



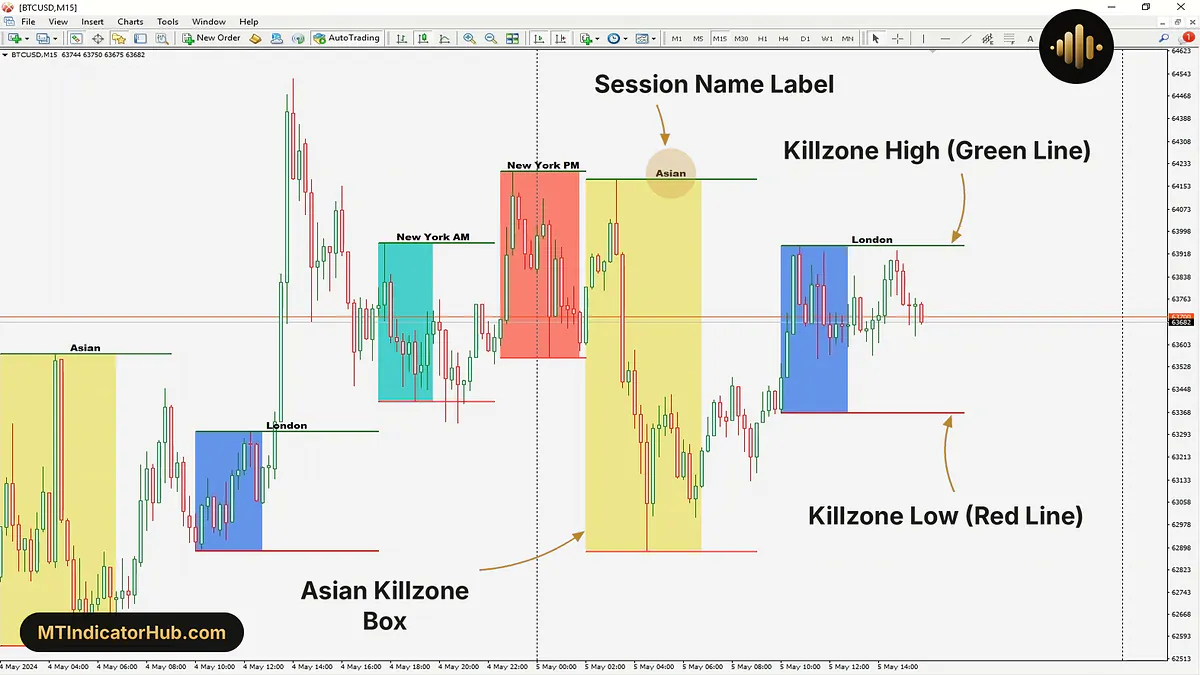
The ICT Killzones MT4 indicator draws the opening stretch of four trading sessions, Asian, London, New York AM and New York PM, as coloured boxes on the price chart, each one running from the session start for a length you set in hours and minutes. A name label sits over every box, and a green line at the killzone's high and a red line at its low carry that range on until the session ends.
Marks the Asian, London, New York AM and New York PM killzones on MT4 as coloured boxes, with green high and red low lines to each session's end.
ICT Killzones Specifications
The Killzones Toolkit indicator draws everything on the main chart with no separate window, and in MetaTrader 4 its boxes appear on timeframes up to H1.
| Item | Details |
|---|---|
| Platform | MetaTrader 4 (MT4); also available for MT5 |
| Categories | ICT, Price Action |
| Indicator type | Session & KillZone |
| Skill level | Advanced |
| Timeframes | M1-M5, M15-M30 and H1 (nothing is drawn above H1 in MT4); shown here on M15 and M30 |
| Trading style | Intraday, Day Trading |
| Markets | Forex, Indices, Commodities, Crypto (shown on BTCUSD) |
| Display | Four killzone boxes in Khaki (Asian), CornflowerBlue (London), MediumTurquoise (New York AM) and Salmon (New York PM), a session name over each box, a green high line and a red low line per killzone |
| Alerts | None |
| Version | 1.0 |
What Is the ICT Killzones Indicator?
The ICT Killzones indicator is a session tool for MetaTrader 4. The forex market trades around the clock, handing over from Asian centres to London and then to New York, and the indicator splits that day into four sessions and marks the killzone of each: the first hours after the session opens. When each session starts is fixed inside the tool, so the Inputs tab has no field for it; what you choose is how long each killzone lasts. The defaults are 4 hours 55 minutes for Asian, 2 hours 55 minutes for London, 2 hours 25 minutes for New York AM and 3 hours 25 minutes for New York PM.
A box covers every candle inside its killzone, and its top and bottom sit at the highest high and the lowest low of those candles. Each session keeps its own colour, and its name is written centred over the box, in black with the White Theme.
Two lines start at the box edges. The green one marks the killzone high, the red one its low, and both keep running to the right after the box ends, up to the end of that session, so the range of the killzone stays in view while the rest of the session trades. The whole span is drawn the moment a session opens: in a Strategy Tester run on BTCUSD M5, a fresh box already stretches ahead of the newest candle to the end of its killzone, and only its height keeps changing as new highs and lows print.
On BTCUSD M15 for 4 and 5 May 2024, the boxes open at 02:00 for Asian, 10:00 for London, 17:30 for New York AM and 22:30 for New York PM on the chart's clock. The London box of 5 May covers the twelve candles from 10:00 to 12:45 and spans 63365 to 63946, the high of the 10:45 candle, a range of 581. Its two lines reach 17:30, where New York AM takes over, even though the newest candle on the chart is the 15:45 one.
Indicator in an Uptrend
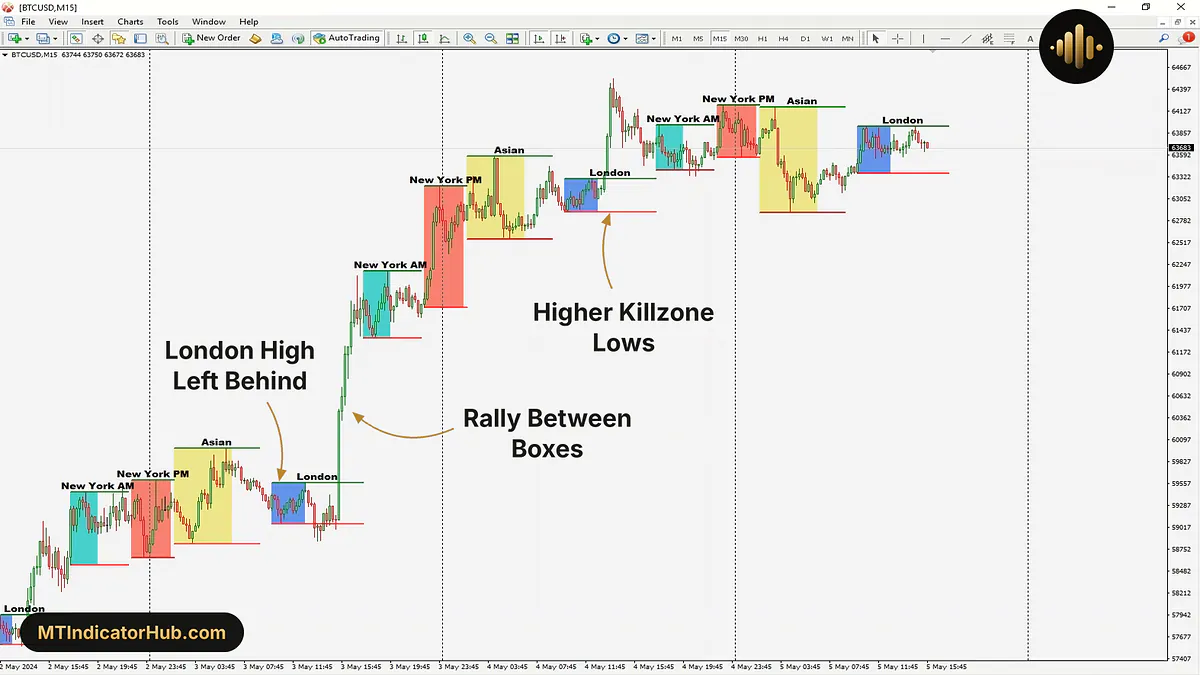
In a rising market the boxes climb the chart in steps, and the clearest sign is the red line under each one: every new killzone low prints above the one before it.
On BTCUSD M15 from 2 to 5 May 2024, six killzones in a row show this. The red lines sit at about 61350 for New York AM on 3 May, about 61724 for New York PM that night, about 62564 for Asian on 4 May, then about 62898 for London, about 63411 for New York AM and about 63566 for New York PM on 4 May. Over the same stretch the box tops climbed too, from about 62172 for New York AM on 3 May to about 64185 for New York PM on 4 May, so each new killzone formed higher on the chart.
The strongest part of the move happened between boxes, and the indicator does not mark it. The London box of 3 May held price between about 59068 and 59573 until 12:45; in the hours after it closed, price ran far above that green line, and the 17:00 candle opened at 61687, reached 62108 and closed at 61585, its 61515 low already about 1942 above the London high. The London lines simply stayed at their levels until 17:30, and the next box, New York AM, formed up near the new prices.
For long trades in a climb like this, the red line of the latest killzone is the nearest reference under price. The stair ended on 5 May, when the Asian box reached down to about 62890, below the red line of the session before, near 63566.
Indicator in a Downtrend
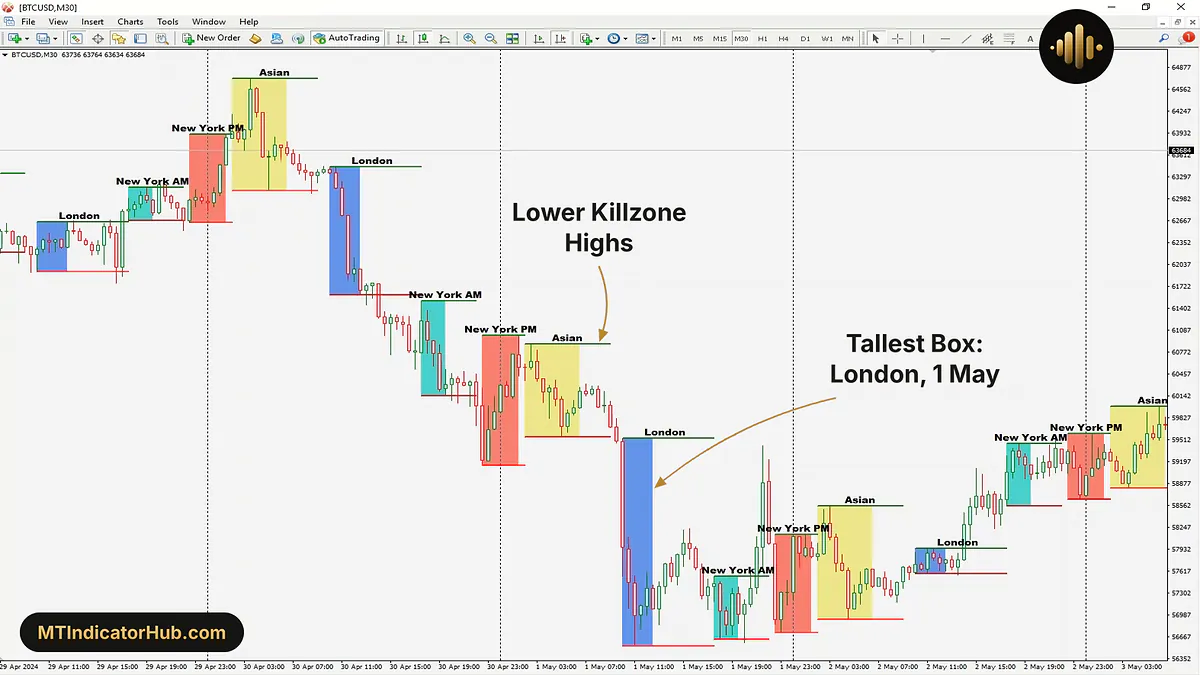
When the market falls, the reading flips to the top of the boxes: each green line, the high of a killzone, lands below the green line of the session before.
BTCUSD M30 from 29 April to 2 May 2024 shows seven such highs in a row. The Asian box of 30 April topped out near 64724, then London reached only about 63452 and New York AM about 61519; that night New York PM peaked near 61022, Asian on 1 May near 60898, London near 59539 and New York AM near 57549.
The London box of 1 May is the tallest on the chart. The sharpest part of the sell-off fell inside that killzone, so the box runs from about 59539 down to about 56545, a drop of about 2994 in six M30 candles, yet it carries the same CornflowerBlue as every London box on a rising day. Box colour shows the session, never the direction; the trend is read from where each box sits compared with the one before.
The same chart shows where the fall ran out. The New York AM box of 1 May bottomed near 56640, the New York PM box after it held above that at about 56736, and the Asian box of 2 May at about 56927: three killzone lows rising in a row.
Indicator Settings
The Inputs tab holds four session blocks, each opened by a text header row, plus one Theme setting at the end.
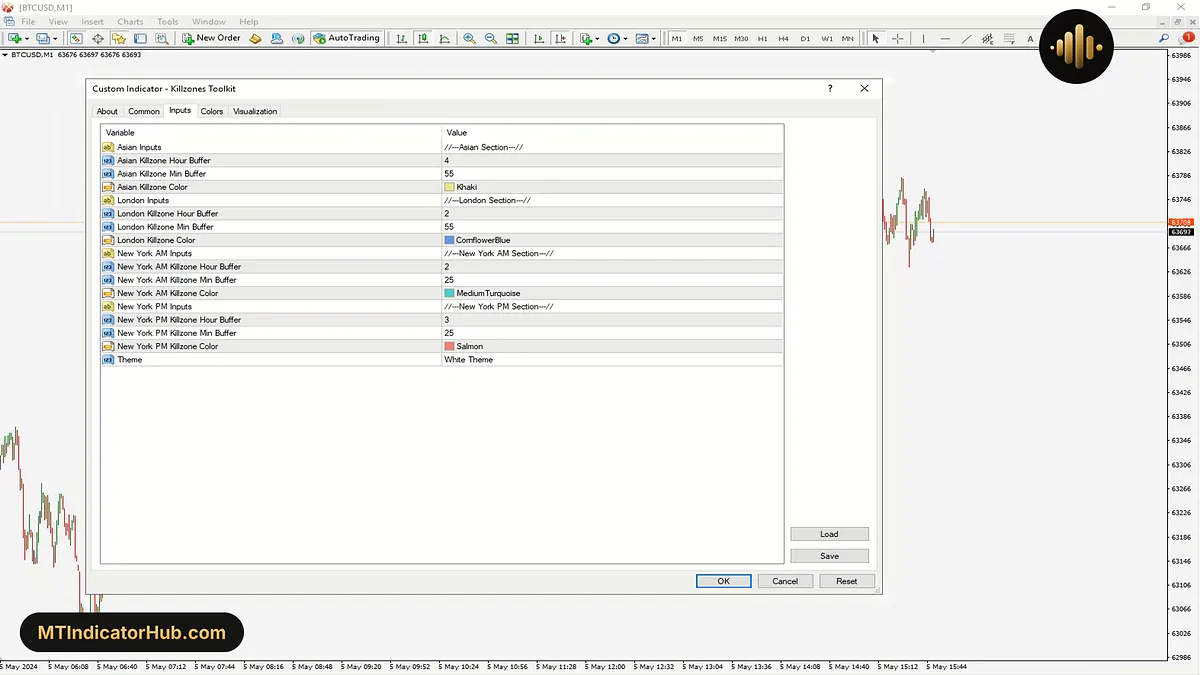
The Asian Section, London Section, New York AM Section and New York PM Section rows only head their blocks and change nothing on the chart. Inside each block, the Hour Buffer and the Min Buffer are added together into the length of that killzone, counted from the session start, and the Color input picks the fill of its box.
| Input | Default | What it changes |
|---|---|---|
| Asian Section: length and colour of the Asian killzone | ||
| Asian Killzone Hour Buffer | 4 | Whole hours of the Asian killzone |
| Asian Killzone Min Buffer | 55 | Minutes added to those hours |
| Asian Killzone Color | Khaki | Fill colour of the Asian box |
| London Section: length and colour of the London killzone | ||
| London Killzone Hour Buffer | 2 | Whole hours of the London killzone |
| London Killzone Min Buffer | 55 | Minutes added to those hours |
| London Killzone Color | CornflowerBlue | Fill colour of the London box |
| New York AM Section: length and colour of the New York AM killzone | ||
| New York AM Killzone Hour Buffer | 2 | Whole hours of the New York AM killzone |
| New York AM Killzone Min Buffer | 25 | Minutes added to those hours |
| New York AM Killzone Color | MediumTurquoise | Fill colour of the New York AM box |
| New York PM Section: length and colour of the New York PM killzone | ||
| New York PM Killzone Hour Buffer | 3 | Whole hours of the New York PM killzone |
| New York PM Killzone Min Buffer | 25 | Minutes added to those hours |
| New York PM Killzone Color | Salmon | Fill colour of the New York PM box |
| Theme: how the session labels look on the chart | ||
| Theme | White Theme | Colour of the session name labels, for a light or a dark chart background |
Because the killzones are set in clock time, the number of candles in a box depends on the timeframe. The 2 hours 55 minutes of London fill 12 candles on M15 (10:00 to 12:45 in the example), 6 on M30 and 3 on H1, while the 4 hours 55 minutes of Asian take 20, 10 and 5. On H4 and higher timeframes the MT4 build draws no boxes.
Conclusion
The ICT Killzones indicator keeps the daily session clock on an MT4 chart: four coloured boxes show where the Asian, London, New York AM and New York PM killzones fall and how far price travelled inside each, and the green and red lines keep those highs and lows in view until the session closes.
It stays a time-and-range map. The session start times cannot be moved from the Inputs tab, only the killzone lengths, the box colours and the label theme. The boxes do not change colour with the market's direction, so up and down are read from how the boxes stack, and a breakout through a green or red line is left unmarked: there are no arrows and no alerts. Its lines stop at the end of their session, and on MT4 nothing is drawn above H1.
Your rating
Rate this indicator
How useful was this indicator? Click a star.
FAQ
Frequently asked questions
The session start times are built into the indicator and have no input. On the BTCUSD charts shown here, the boxes open at 02:00 for Asian, 10:00 for London, 17:30 for New York AM and 22:30 for New York PM on the chart's own clock. Only the length of each killzone is set by you.
Each box lasts its Hour Buffer plus its Min Buffer, counted from the session start. With the defaults that is 4 hours 55 minutes for Asian, 2 hours 55 minutes for London, 2 hours 25 minutes for New York AM and 3 hours 25 minutes for New York PM. Changing either buffer widens or narrows the box.
The green line is the highest price of the killzone and the red line its lowest, so they sit on the top and the bottom edge of the box. After the box ends, both lines carry on to the right until that session is over, which keeps the killzone range visible for the rest of the session.
The MT4 build draws its boxes only on timeframes up to H1, so H4, D1 and higher charts stay empty. On H1 the boxes are already short: a London killzone of 2 hours 55 minutes fits into 3 candles and an Asian one into 5.
Theme sets the colour of the session names written over the boxes, so they stay readable on a light or a dark chart. With White Theme, the default, the Asian, London, New York AM and New York PM labels are drawn in black.





Comments
Be the first to comment.