


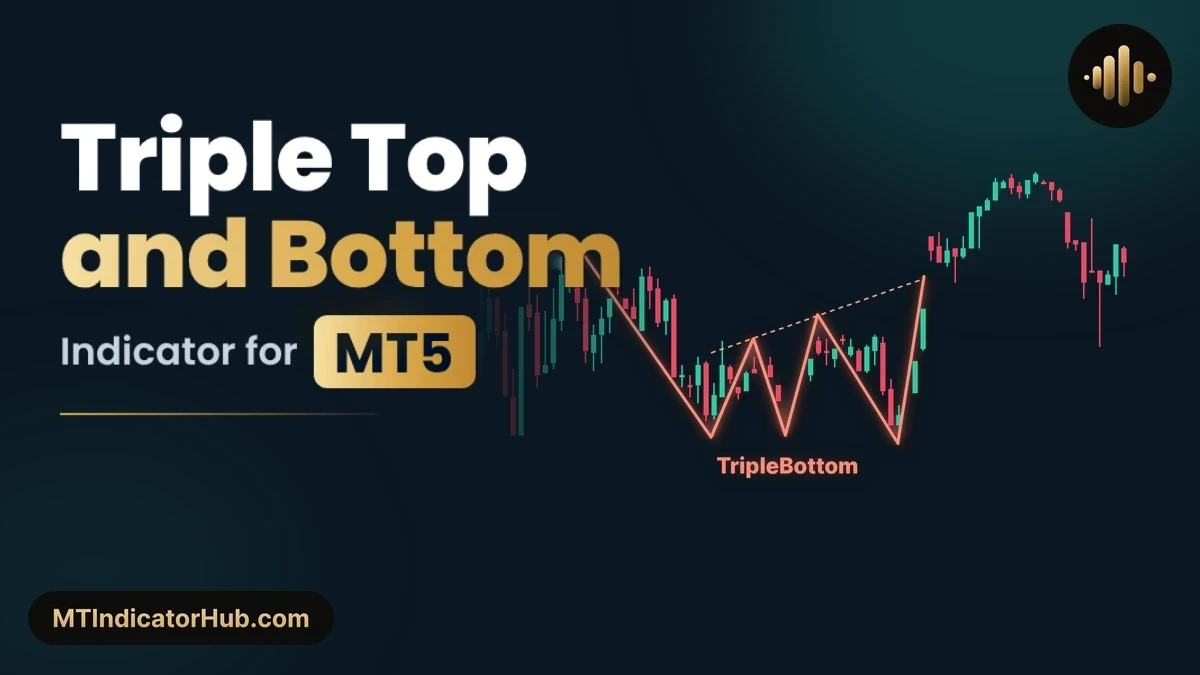
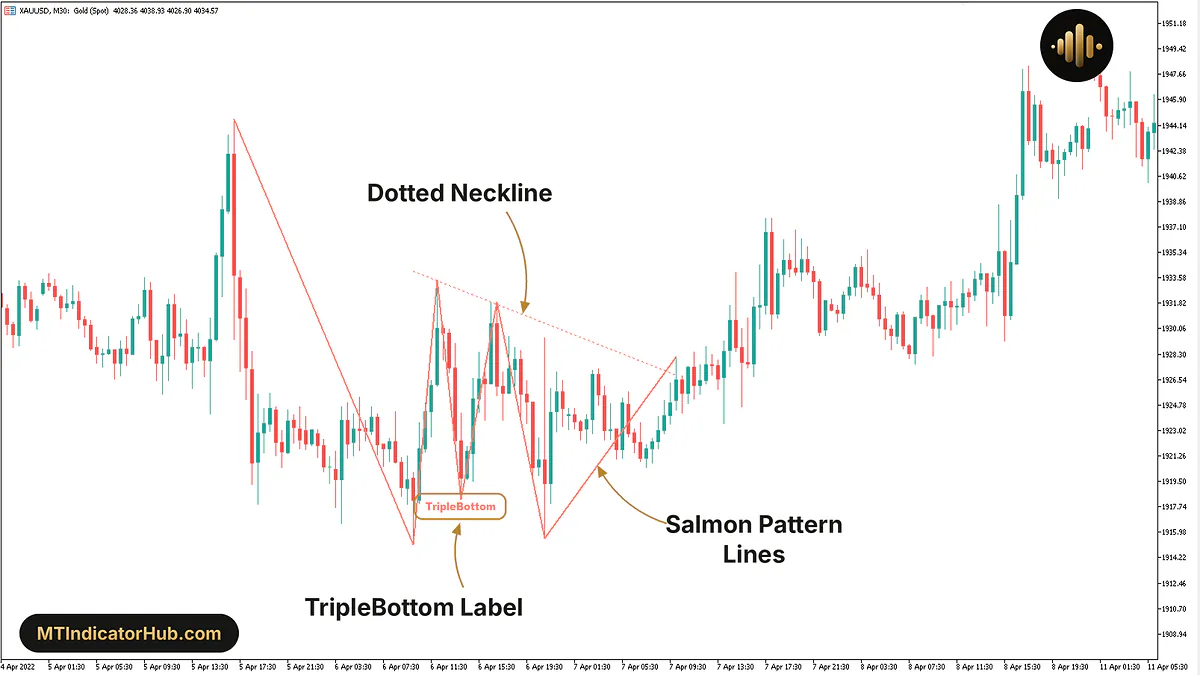
The Triple Top and Bottom indicator for MetaTrader 5 looks for three swing highs, or three swing lows, at practically the same price, then draws the shape on the price chart once it finds them. Tops come in CornflowerBlue with a TripleTop label, bottoms in Salmon with a TripleBottom label, and each one carries a dotted neckline.
Finds three swing highs or lows at practically one price on MT5 and draws them as a labelled triple top or triple bottom with its neckline.
Triple Top and Bottom Specifications
The patterns are drawn straight over the candles, so the tool needs no subwindow and shows no panel.
| Specification | Detail |
|---|---|
| Platform | MetaTrader 5 (MT5); also available for MT4 |
| Categories | Price Action |
| Indicator type | Chart patterns, reversal |
| Skill level | Beginner |
| Timeframes | Any; shown here on M5 |
| Trading style | Intraday, swing trading |
| Markets | Forex, gold, indices, crypto, stocks |
| Display | Pattern lines, TripleTop / TripleBottom label, dotted neckline, optional zigzag, all on the price chart |
| Alerts | None |
What Is the Triple Top and Bottom Indicator?
Classic chart reading calls it a triple top when a market fails three times at the same ceiling, and a triple bottom when it holds three times at the same floor. This tool does that reading for you. It builds a zigzag from the chart, takes the swing points it confirms and compares every set of three adjacent highs or lows.
The comparison uses the Average True Range as its ruler. Proximity Factor, 0.5 out of the box, is the number of ATRs the turns may drift apart, and the same allowance applies to the two swings between them. Half an ATR is a strict limit, which is why the default prints only shapes that look textbook clean, and not many of them.
Once three turns pass, the drawing goes up: solid lines that start one swing ahead of the first turn, pass through all five points and stop at the candle that carries price back through the neckline, the pattern's name under the middle low or over the middle high, and a thin dotted neckline linking the pair of inner swings. The zigzag itself is off by default; switching Show Zig Zag Line on adds it in turquoise, drawn dash-dot. Taking the indicator off the chart removes all of its objects.
Bullish Pattern
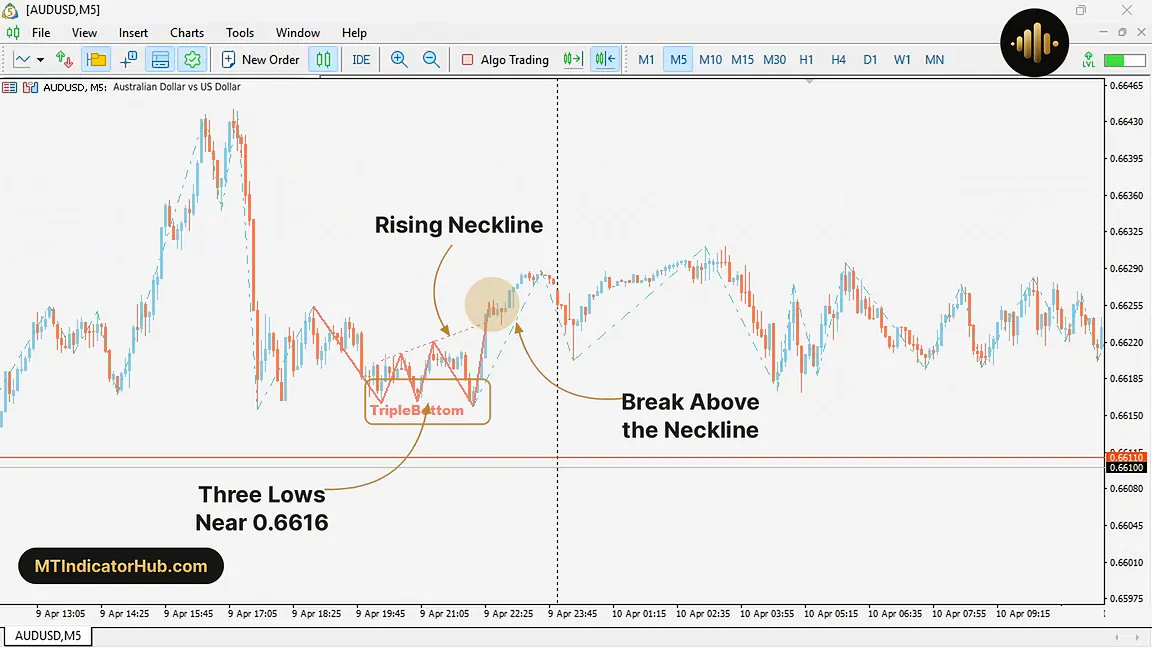
Three lows at one level and two rebounds that fail to run away make a triple bottom. The rebound highs define the neckline, with Salmon lines covering the whole move, from the swing high above the first low to the candle that lifts price back over that line.
AUDUSD M5 on 9 Apr shows it with the default settings. From the 18:50 level of about 0.66253 the pair fell to roughly 0.66162 near 20:15, rebounded to 0.66208, touched 0.66164 on the 21:00 candle, rose to 0.66220 and printed a third low close to 0.66160 around 22:10. All three lows fit inside half a pip, comfortably within a 0.5 factor. The neckline slopes up through the 0.66208 and 0.66220 rebounds; at 22:25 a candle took price over it near 0.66239, and by 23:15 the pair stood around 0.66283.
On the long side the two reference points come straight from the drawing: the neckline as the level to get above, and the 0.66160 floor of the three lows as the price that would undo the shape.
Bearish Pattern
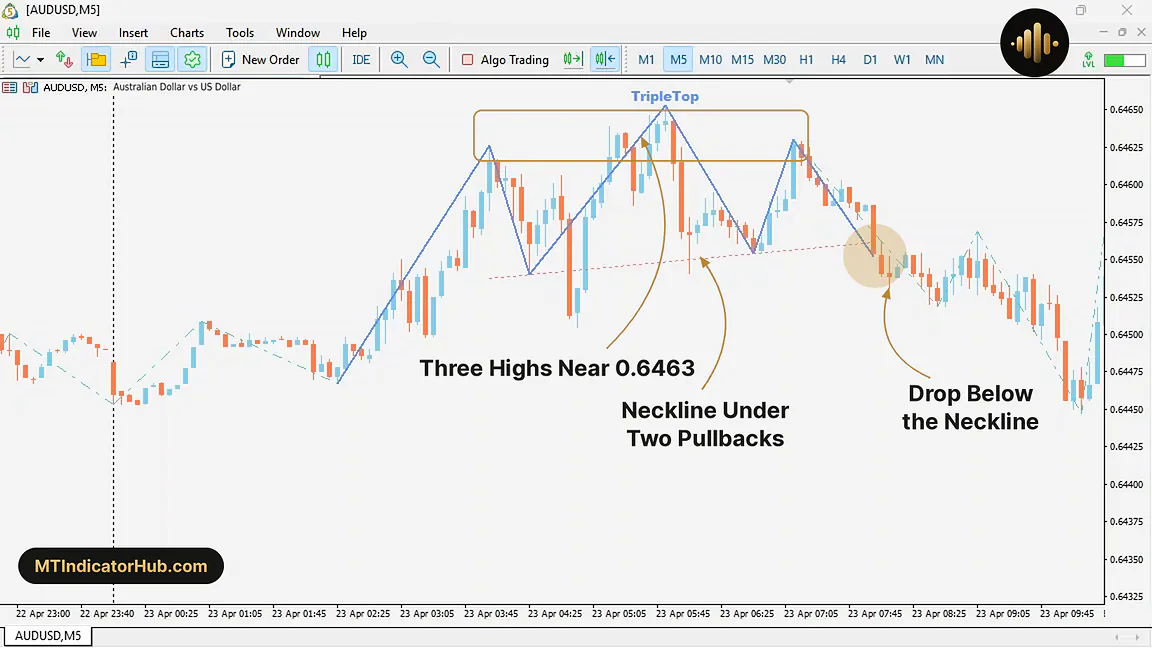
The mirror image is three rallies that die at one ceiling. The pullbacks between them set a neckline underneath, and the CornflowerBlue lines finish at the candle that drops price below it.
For the 23 Apr frame Proximity Factor stood at 1.5. The first high came at 04:00 near 0.64625, the second at 05:50 near 0.64652 and the third at 07:10 near 0.64629, with dips of 0.64541 and 0.64554 between them. Price lost the neckline near 0.64559 around 08:00 and dipped to about 0.64450 by about 10:05, roughly two hours later.
A factor of 1.5 lets the turns sit 1.5 ATRs apart, so this setting catches many more patterns than the default, including some that only roughly look like three equal highs. Raise it step by step and stop where the drawings still match the shape you trade. A short idea watches for price to give up the neckline, and the 0.64652 high of the middle rally marks the failure point.
Indicator Settings
Eleven inputs sit on the Inputs tab, split by two header rows into a zigzag block and a pattern block.
| Input | Default | What it changes |
|---|---|---|
| Zig Zag Line: the swing points every pattern is built from | ||
| Show Zig Zag Line | false | Displays the zigzag on the chart |
| Pivot Period Of Zig Zag Line | 3 | How many candles confirm a swing; higher values leave only larger swings |
| Zig Zag Line Style | Dashdot | Style of the zigzag line |
| Zig Zag Line Color | MediumTurquoise | Zigzag colour |
| Zig Zag Line Width | 1 | Zigzag thickness |
| TripleBottom & TripleTop: how close the turns must be and how patterns look | ||
| Proximity Factor (Max Distance Of TripleBottom & TripleTop Pivot) | 0.5 | Allowed spread of the three turns, and of the two swings between them, in ATR multiples; larger means more and looser patterns |
| Show TripleBottom & TripleTop | true | Turns the pattern drawings on or off |
| TripleTop Color | CornflowerBlue | Lines and label of triple tops |
| TripleBottom Color | Salmon | Lines and label of triple bottoms |
Two inputs decide which patterns exist: the pivot period and Proximity Factor. The rest only style what is drawn. On M5 the default of 3 candles covers a quarter of an hour; on M15 it stretches to 45 minutes, so the swings, and the patterns built on them, come from wider moves.
Conclusion
A trio of turns at almost the same price, joined into a labelled shape with its neckline: that is the whole output of the indicator on MetaTrader 5.
How many shapes appear depends on Proximity Factor. The default 0.5 keeps them few and clean; larger values bring in looser ones, and at those settings a single range can hold a triple top and a triple bottom at the same time. There are no arrows, alerts or panels, and every object goes away when the indicator is removed.
Your rating
Rate this indicator
How useful was this indicator? Click a star.
FAQ
Frequently asked questions
Quite strict. With Proximity Factor at 0.5, the three highs or lows may be at most half an ATR apart, and the two swings between them face the same limit, so only close matches are drawn.
At the candle that takes price back through the neckline. The solid lines start one swing ahead of the first turn and stop at that candle, while the dotted neckline spans the width of the pattern.
Yes: switch Show Zig Zag Line on, and a MediumTurquoise dash-dot zigzag is drawn whose swings follow Pivot Period Of Zig Zag Line, set to 3 out of the box. Every swing behind a pattern is then visible.
The factor is a distance limit counted in ATRs. Three times the allowance means turns that are further apart still qualify, so more shapes pass, and some of them resemble the pattern only loosely.






Comments
Be the first to comment.