



RSI Color Candles for MT4 reads RSI(14) on every bar and shows the result as the colour of the bar itself, so no line is needed under the chart. Green means RSI is over 60, blue sits from 50 to 60, orange from 40 to 50, and red means under 40. With Breakout as the default mode, an arrow marks the bar where RSI first crosses into an outer zone: up through 60 for a Buy, down through 40 for a Sell.
Paints each MT4 bar in one of four RSI(14) zones and marks with an arrow the bar where RSI first closes over 60 (Buy) or under 40 (Sell).
RSI Color Candles Specifications
The MT4 build draws on the main chart only, opens no window of its own, and adds an arrow just after the bar has closed.
| Item | Details |
|---|---|
| Platform | MetaTrader 4 (MT4); also available for MT5 |
| Categories | Oscillators, Signal & Forecast |
| Indicator type | Trend, Breakout, Entry Exit |
| Skill level | Intermediate |
| Timeframes | Any (this page: M5 and M15) |
| Trading style | Scalper, Intraday |
| Markets | Forex, Commodities, Indices, Crypto, Stock (example: XAUUSD) |
| Display | Every bar coloured by its RSI zone (green, blue, orange, red; grey at 50); Buy and Sell arrows; RSI / Market / Signal panel |
| Alerts | None |
| Version | 1.0 |
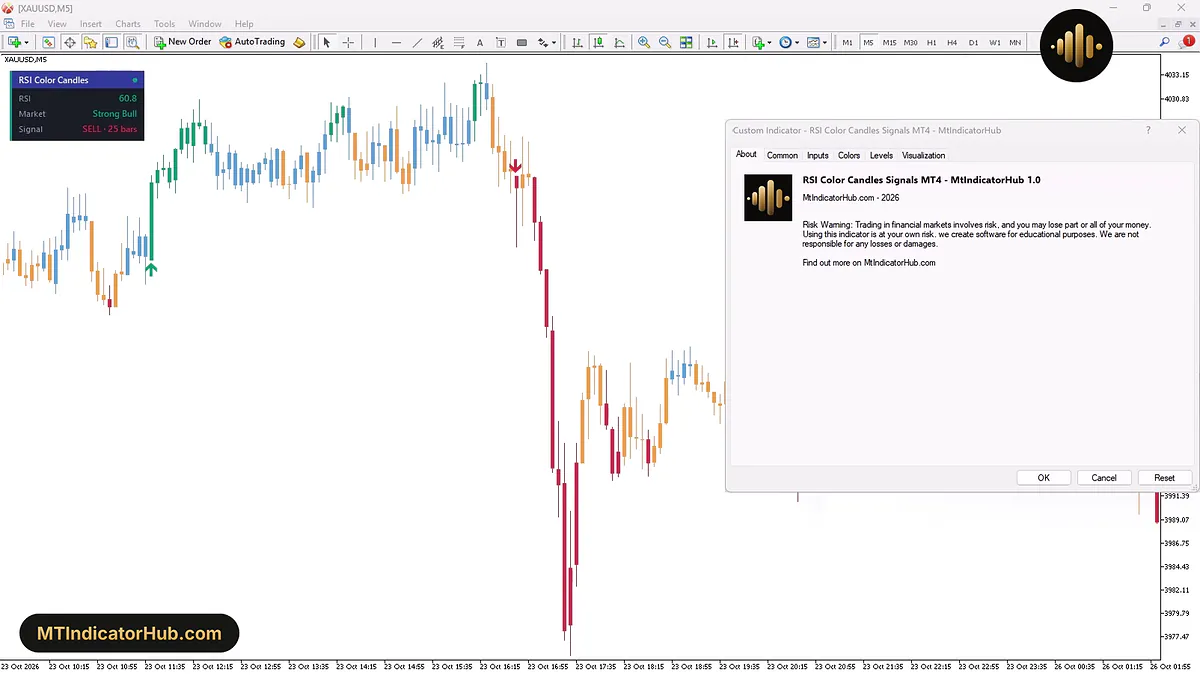
With the indicator's properties open on the About tab, the XAUUSD M5 chart keeps its panel in view: RSI at 60.8, Strong Bull as the Market and SELL · 25 bars as the Signal, above bars in all four zone colours.
What Is the RSI Color Candles Indicator?
On MT4, RSI Color Candles moves the relative strength index from a lower window onto the price bars. RSI is worked out over 14 bars of closing prices, and each bar is painted in the colour of the zone its reading falls into. The zone borders are inputs, 60 for strong bull and 40 for strong bear, and 50 splits the middle.
- Green bar: RSI over 60, the strong bull zone;
- Blue bar: RSI from 50 up to 60, bullish;
- Orange bar: RSI from 40 up to 50, bearish;
- Red bar: RSI under 40, the strong bear zone;
- Grey bar: RSI sitting exactly on 50.
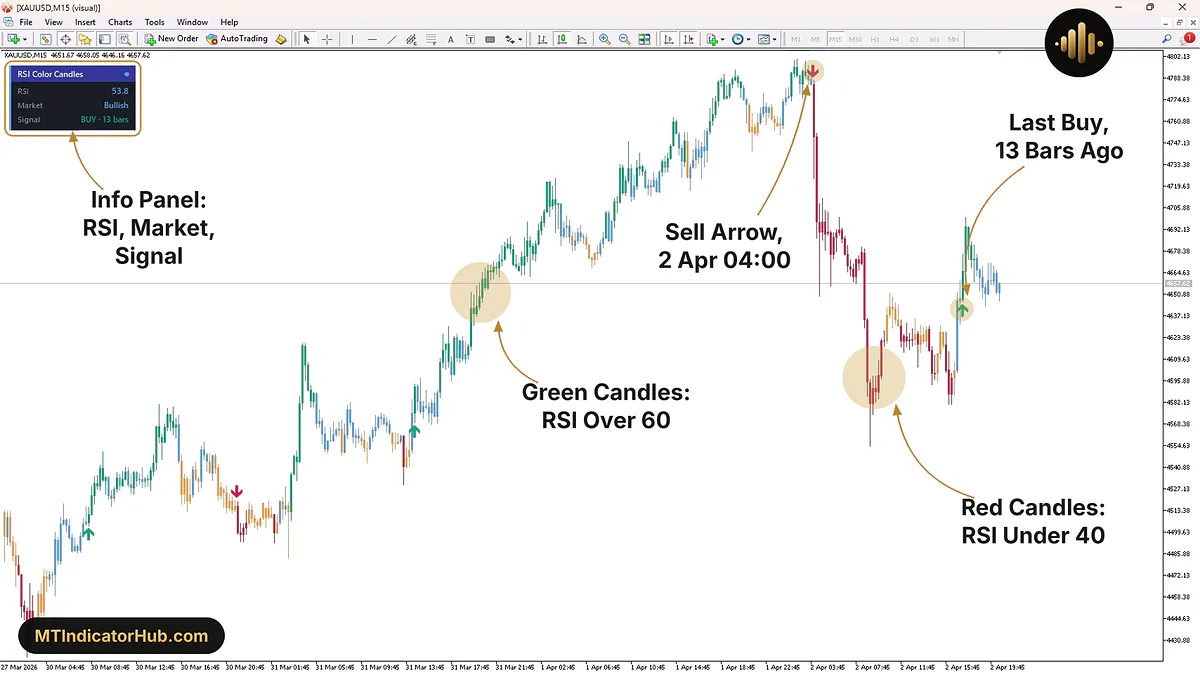
In the chart's upper left corner, a panel headed RSI Color Candles keeps three live readings in view. The RSI row holds the live reading; the Market row shows Strong Bull, Bullish, Bearish or Strong Bear; the Signal row reports which way the newest arrow points, plus a count of closed bars, for example BUY · 13 bars.
The visual test below runs XAUUSD M15 from 27 March to 2 April 2026, and BUY · 13 bars in the panel counts from the Buy Arrow of 17:15 on 2 April.
Buy Signal
In Breakout mode the indicator looks for a bar that closes with RSI over the Upper (strong bull) level, 60, right after a bar that closed under it. On the chart that is the first green bar after a stretch of blue or orange, with the Buy Arrow drawn below its low.
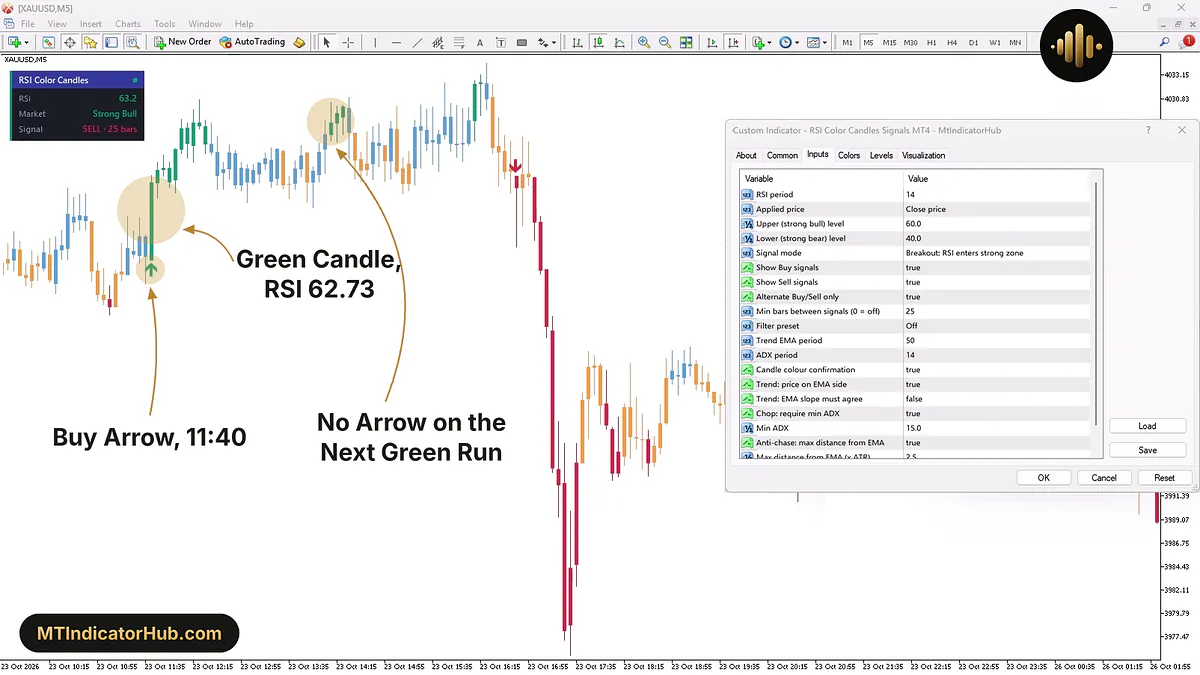
One example comes at 11:40 on 23 October 2026, XAUUSD M5. The 11:10 bar was orange at RSI 46.90, the bars between 11:20 and 11:35 were all blue, with 11:35 closing at an RSI of 50.24. Then the 11:40 bar opened at 4014.78 and closed at 4022.49, lifting RSI to 62.73. The bar went green, and its Buy Arrow was placed beneath the 4014.77 low. RSI climbed further, 64.36 by 11:45 and 67.38 by 12:15. Ten green bars in a row ran to 12:25, and at 12:30 RSI eased to 59.75 and the bar went blue.
Not every return to green earns a mark. Two inputs decide that: Min bars between signals wants 25 closed bars between consecutive arrows, while Alternate Buy/Sell only accepts a Buy solely after a Sell. Green came back at 14:10, after a blue bar at 14:05; 30 bars had passed since 11:40, so the gap rule was met, but the alternation rule blocked a second Buy Arrow, since the previous mark was a Buy as well.
Traded long, the arrow gives a buy at 4022.49, the 11:45 open, and a stop below 4014.77, a risk of 7.72. By the 12:15 close of 4028.42, price stood 5.93 over that entry. While the bars stay green RSI is still over 60, and the first blue bar shows the push has slowed.
Sell Signal
The reverse move produces a Sell Arrow: a bar that closes with RSI under the Lower (strong bear) level, 40, after a bar above it. Visually, that means the first red bar after orange or blue ones, with the arrow placed over the high.
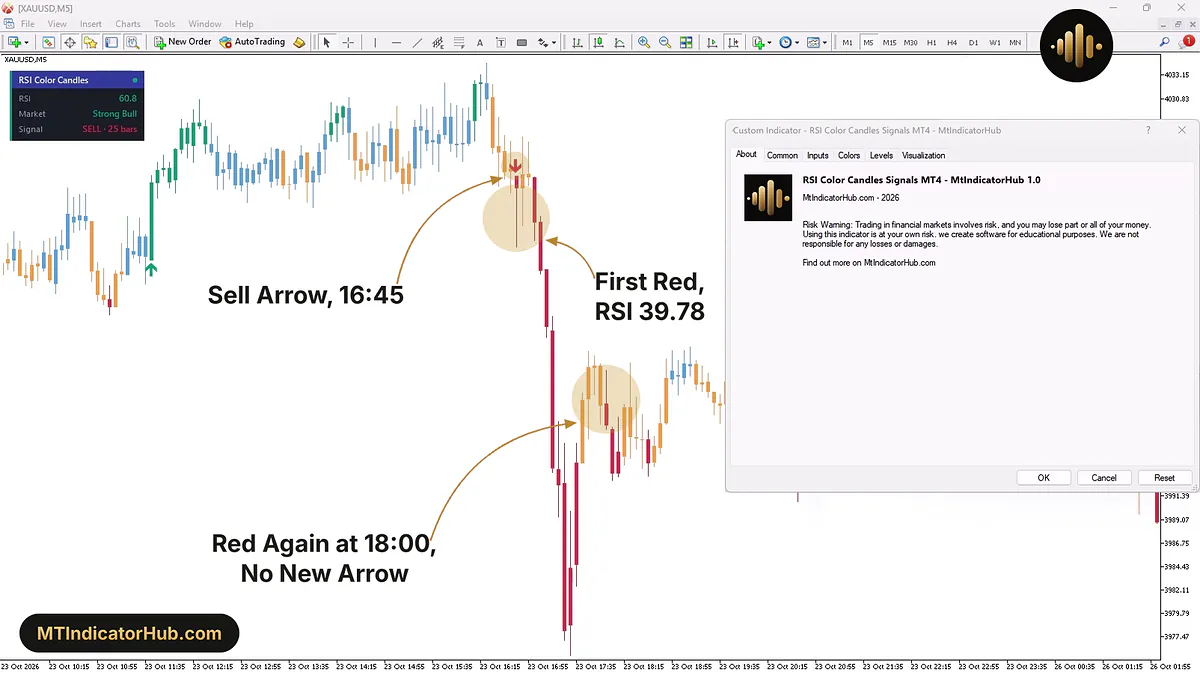
That afternoon the 16:35 and 16:40 bars were orange, the first one at RSI 42.72. The 16:45 bar opened at its high of 4023.10, found a low of 4016.12 and settled at 4021.98; RSI ended at 39.78, a fraction under 40, so the bar went red and carried the Sell Arrow. Sixty-one bars had closed since the 11:40 Buy, which met both filters.
The drop that followed was steep. By 17:15 RSI was down to 15.63, by 17:25 to 10.87, and the 17:30 bar hit 3975.59, which is 46.39 below the 16:45 close, nine bars after the signal. A short at that close, with its stop a little above the 4023.10 high, put 1.12 at risk.
Red bars without an arrow turn up in the same fall. RSI got back over 40 at 16:50 and 16:55, so those bars were orange, and the 17:00 bar was red once more, three bars after the signal. At 18:00 the bars went red again after four orange ones; fifteen bars from the Sell Arrow, it sat inside the 25-bar gap, and Alternate Buy/Sell only never lets one Sell follow another.
Indicator Settings
Twenty inputs sit in the Inputs tab, more than the window can show at once, so the last ones come into view with the scroll bar.
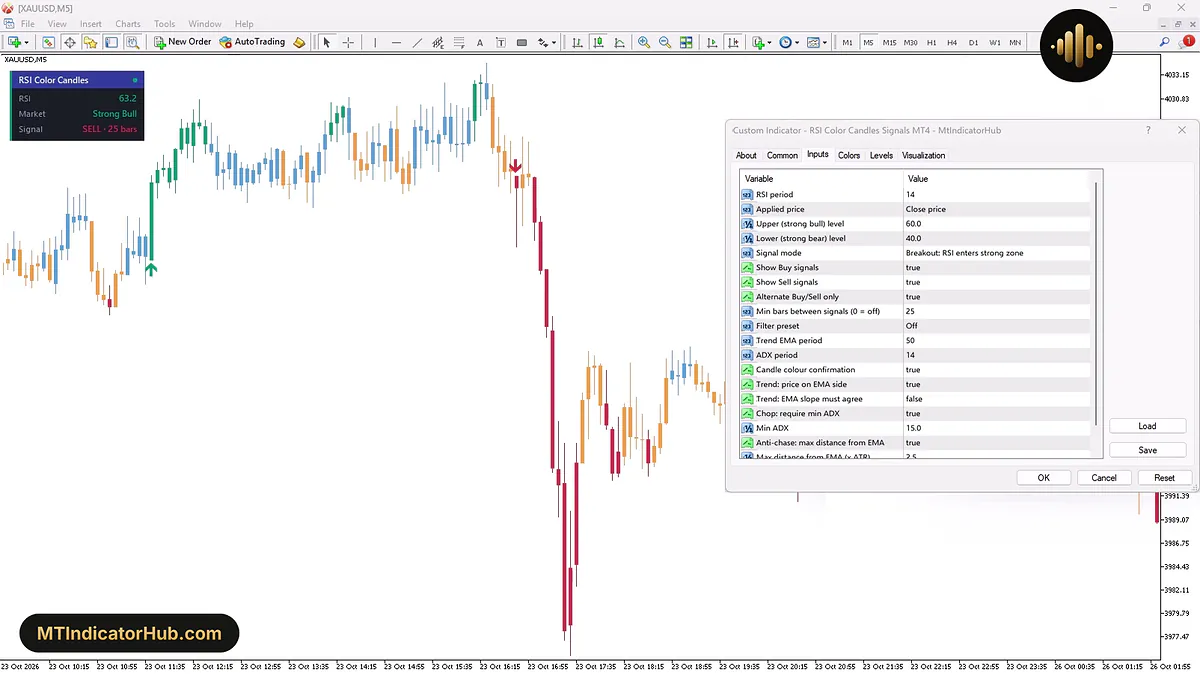
Filter preset reads Off here, the value the example charts were made with, so they hold every raw Breakout arrow; Light, Balanced and Strict take some away. The seven checks from Candle colour confirmation to Max distance from EMA (x ATR) apply only when Filter preset is set to Custom (settings below).
| Input | Default | What it changes |
|---|---|---|
| RSI period | 14 | How many bars the RSI looks back over |
| Applied price | Close price | Price series the RSI is computed from |
| Upper (strong bull) level | 60.0 | Border of the green zone and of Strong Bull in the panel |
| Lower (strong bear) level | 40.0 | Border of the red zone and of Strong Bear in the panel |
| Signal mode | Breakout: RSI enters strong zone | Arrow trigger: into a strong zone, out of an OB/OS zone (Reversal) or through 50 (Trend) |
| Show Buy signals | true | Buy Arrows stay off the chart when false |
| Show Sell signals | true | Sell Arrows stay off the chart when false |
| Alternate Buy/Sell only | true | The next arrow has to be on the opposite side |
| Min bars between signals (0 = off) | 25 | Closed bars required between two arrows; 0 disables the rule |
| Filter preset | Balanced | Choice of Off, Light, Balanced, Strict or Custom (settings below) |
| Trend EMA period | 50 | Number of bars in the EMA that the side, slope and distance tests use |
| ADX period | 14 | Bars in the ADX read by the chop check |
| Candle colour confirmation | true | A Buy needs an up-closing bar, a Sell a down-closing bar |
| Trend: price on EMA side | true | A Buy needs the close over the EMA, a Sell a close below the EMA |
| Trend: EMA slope must agree | false | A Buy needs the EMA higher than 3 bars earlier, a Sell lower |
| Chop: require min ADX | true | Blocks arrows while ADX is below Min ADX, a sign of a range |
| Min ADX | 15.0 | Lowest ADX the chop check accepts |
| Anti-chase: max distance from EMA | true | Blocks arrows when price has moved a long way from its EMA |
| Max distance from EMA (x ATR) | 2.5 | That distance limit, counted in ATR |
| Show info panel | true | false hides the RSI / Market / Signal readout |
The presets are bundles of those checks. Off lets every raw signal through. Light checks the bar colour and keeps price within 3 ATR of the EMA. Balanced also wants the close on the matching side of the EMA and ADX of 15 or more, and tightens the limit to 2.5 ATR. Strict brings in the EMA slope, needs ADX of 20 and allows only 2 ATR, which gives the smallest number of arrows. A signal stopped by a check leaves nothing behind: no arrow is drawn, and the Signal readout in the panel does not change.
Counted in time, 14 bars of RSI cover 70 minutes on M5 and 3 hours 30 minutes on M15. The 25-bar gap equals 125 minutes on M5; M15 stretches it to 6 hours 15 minutes. The 50-bar EMA reaches back 4 hours 10 minutes of M5 bars.
Conclusion
The RSI Color Candles MT4 indicator shows RSI as bar colour and adds an arrow where the reading first reaches a strong zone: over 60 for Buy and under 40 for Sell in Breakout mode.
Since an arrow only comes after its bar closes, part of the swing has already passed by the time it appears. The 25-bar gap and the alternation rule mean a later move back into the same zone is coloured but not marked. The colours follow RSI alone; the EMA, slope and ADX tests affect just the arrows, and only after Filter preset is moved away from Off. No input among the 20 turns on an alert of any kind, so spotting a fresh arrow is left to the trader's eye, while the panel sits over the top left bars unless the Show info panel input is false.
Your rating
Rate this indicator
How useful was this indicator? Click a star.
FAQ
Frequently asked questions
No. It stays on the main chart: RSI(14) is shown through the bar colours, and the panel prints the exact value in its RSI row. Nothing appears under the price area, so no extra window takes up room.
Open the indicator's properties, go to the Inputs tab and edit Upper (strong bull) level and Lower (strong bear) level. The green and red zones and the Strong Bull and Strong Bear readings of the panel move with them, and so do the Breakout arrows, which fire on entry into those zones.
Yes. Set Show Sell signals to false to keep only Buy Arrows, or Show Buy signals to false for Sell Arrows only. The bars keep all of their RSI colours either way.
Strict stacks the most checks: the bar colour, the close on the EMA side, an EMA slope that agrees, ADX of at least 20 and price no more than 2 ATR from the EMA. A signal that misses any one of them is skipped, so quiet or stretched markets get far fewer arrows than with Off or Light.
Two things: which side the last arrow was on (BUY or SELL) and how many closed bars have followed it. During the XAUUSD M15 visual test, the row read BUY · 13 bars at the 20:30 bar of 2 April 2026, 13 bars after the Buy Arrow of 17:15.





Comments
Be the first to comment.