


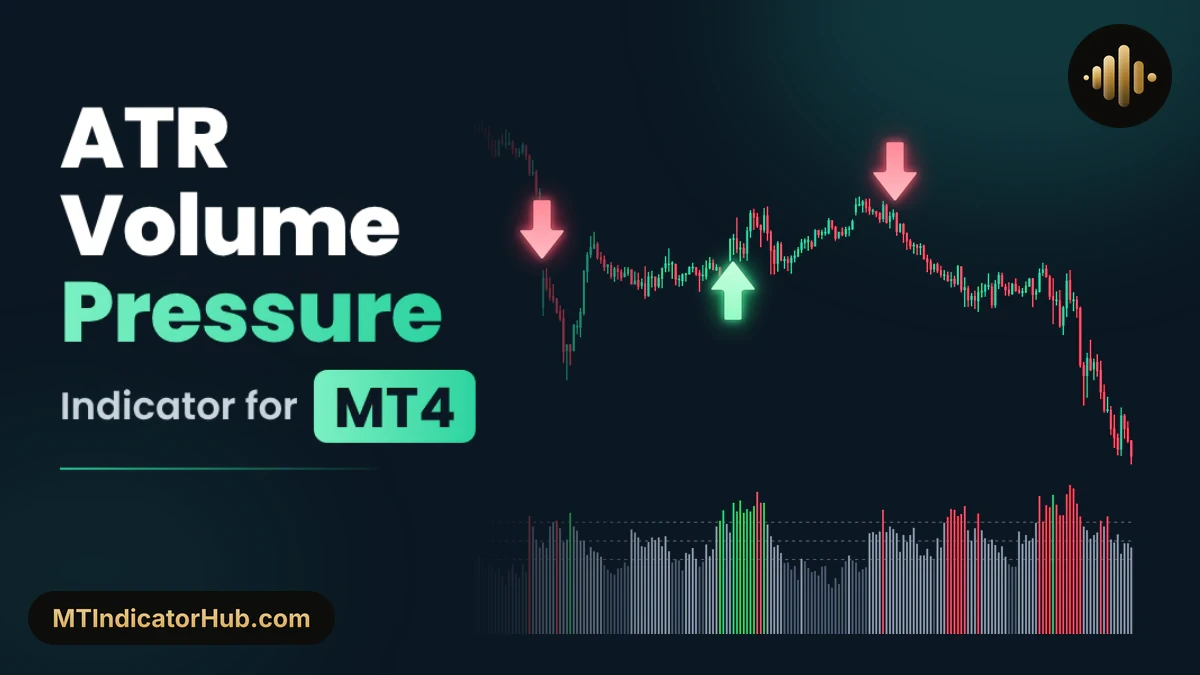
On MetaTrader 4, the ATR Volume Pressure indicator turns the range and the volume of every candle into one pressure score between 0 and 100 and plots it as a four-colour histogram in its own subwindow. When that score first clears 60, the High (expansion) level, a Buy Arrow is printed under the candle or a Sell Arrow above it, and the side follows where price closed against the candle 10 bars back.
Rates each MetaTrader 4 candle's range and volume on a 0 to 100 scale and marks the first close above 60 with an arrow whose side follows price 10 bars back.
ATR Volume Pressure Specifications
The MT4 build keeps its pressure score in a subwindow below the price chart and fixes every arrow once its candle has fully closed.
| Item | Details |
|---|---|
| Platform | MetaTrader 4 (MT4); also available for MT5 |
| Categories | Oscillators, Volume, Signal & Forecast |
| Indicator type | Volatility, Volume, Breakout |
| Skill level | Intermediate |
| Timeframes | Any; shown here on M15 |
| Trading style | Intraday, Day Trading |
| Markets | Metals, Forex (shown on XAUUSD) |
| Display | 0 to 100 pressure histogram in a subwindow with dashed lines at 60, 50 and 40; arrows for Buy and Sell on the price chart; status panel showing Value, Market and Last signal |
| Alerts | None |
| Version | 1.0 |
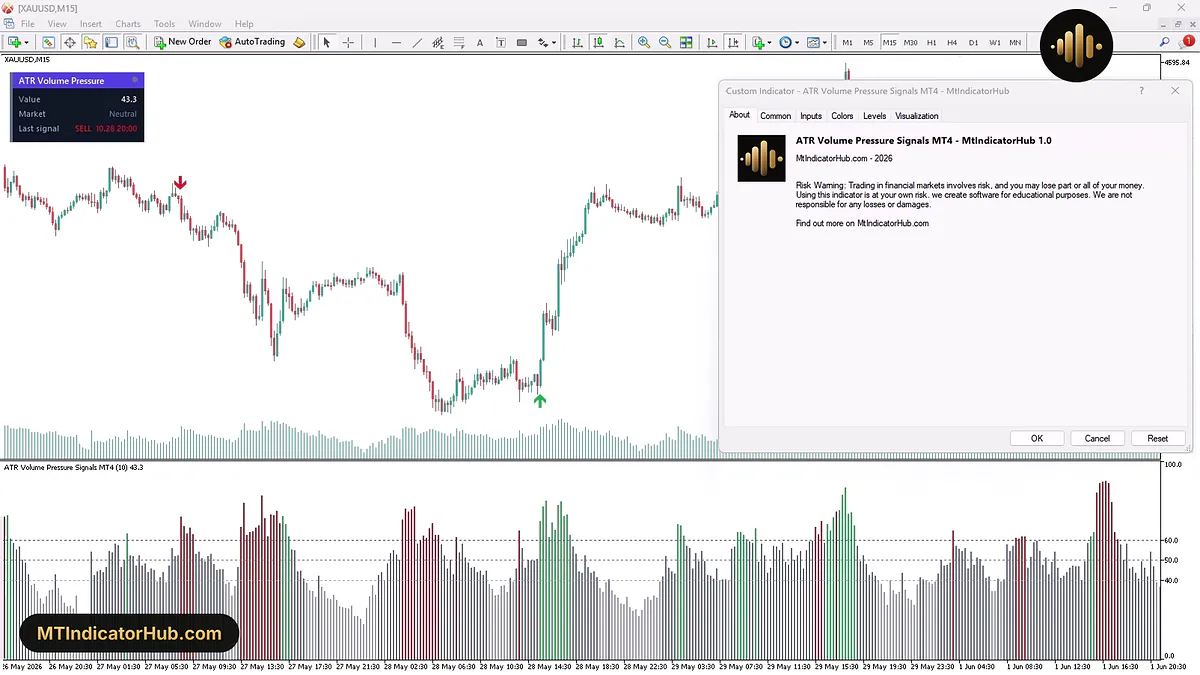
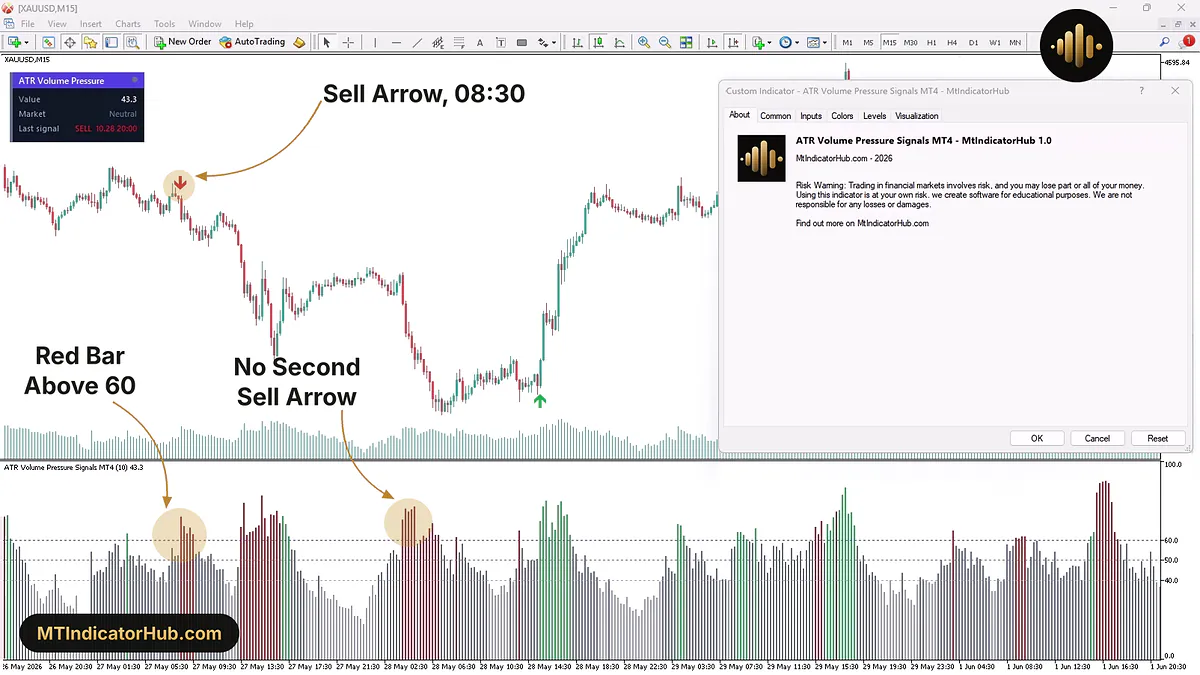
Over the About tab, the status panel in the top left corner of the XAUUSD,M15 window gives a Value of 43.3 with Market at Neutral, while the subwindow underneath holds the green, red and grey pressure bars.
What Is the ATR Volume Pressure Indicator?
The ATR Volume Pressure indicator is a pressure oscillator for MetaTrader 4 that watches two sides of every candle at once: the distance price covered, taken as the ATR (average true range) of recent candles, and the volume traded behind it. Over the Pressure period, 10 candles unless changed, it weighs whether that joint pressure has been rising or falling and scales the result to a score between 0 and 100. A high score says trading activity is picking up fast; a low one says the market has gone quiet.
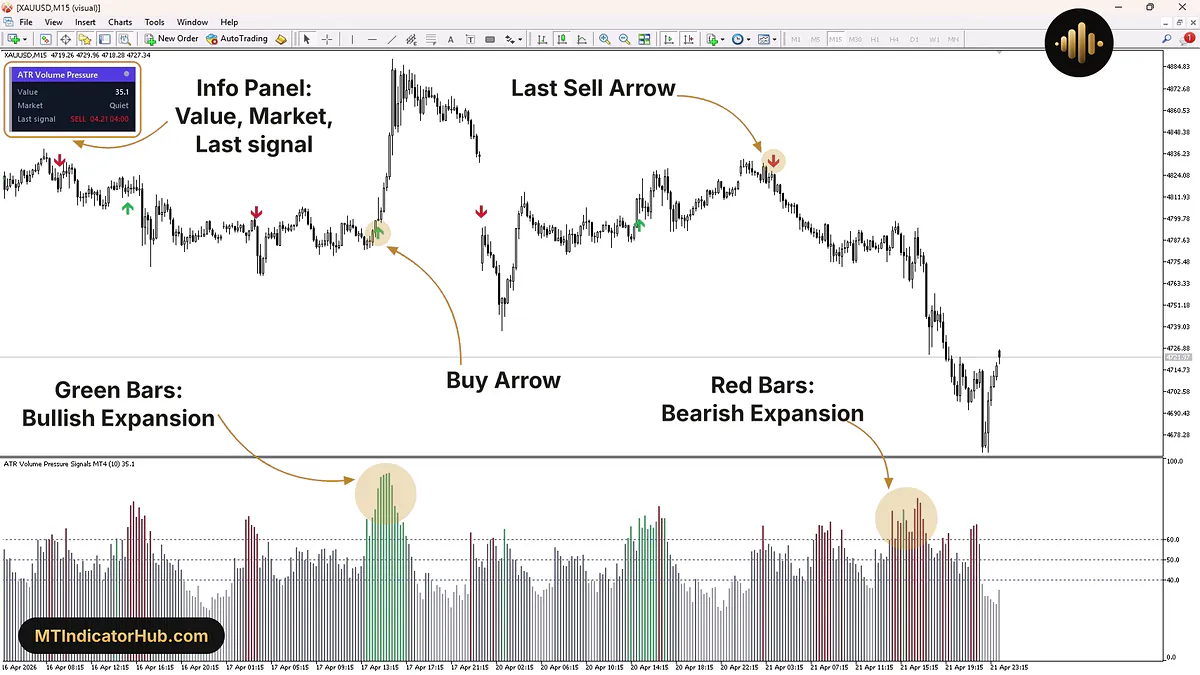
Three dashed lines run across the subwindow: 60 for the High (expansion) level, 40 for the Low (quiet) level and 50 halfway between them. The colour of each bar gives the state:
- green: a score of 60 or more, with price above where it closed 10 candles earlier;
- red: a score of 60 or more, with price below that close;
- dark grey: a score from 40 to 60, a neutral phase;
- light grey: a score below 40, a quiet phase.
The status panel spells out the same state in three rows. Value holds the current score, Market names it (Bullish Expansion, Bearish Expansion, Neutral, Quiet), and the Last signal row records which side the latest arrow was on, with its date and time.
On MetaTrader 4 the volume of a candle is normally its tick count, so the default Tick volume setting is the one with numbers behind it; Real volume is the second choice of the Volume type input.
Buy Signal
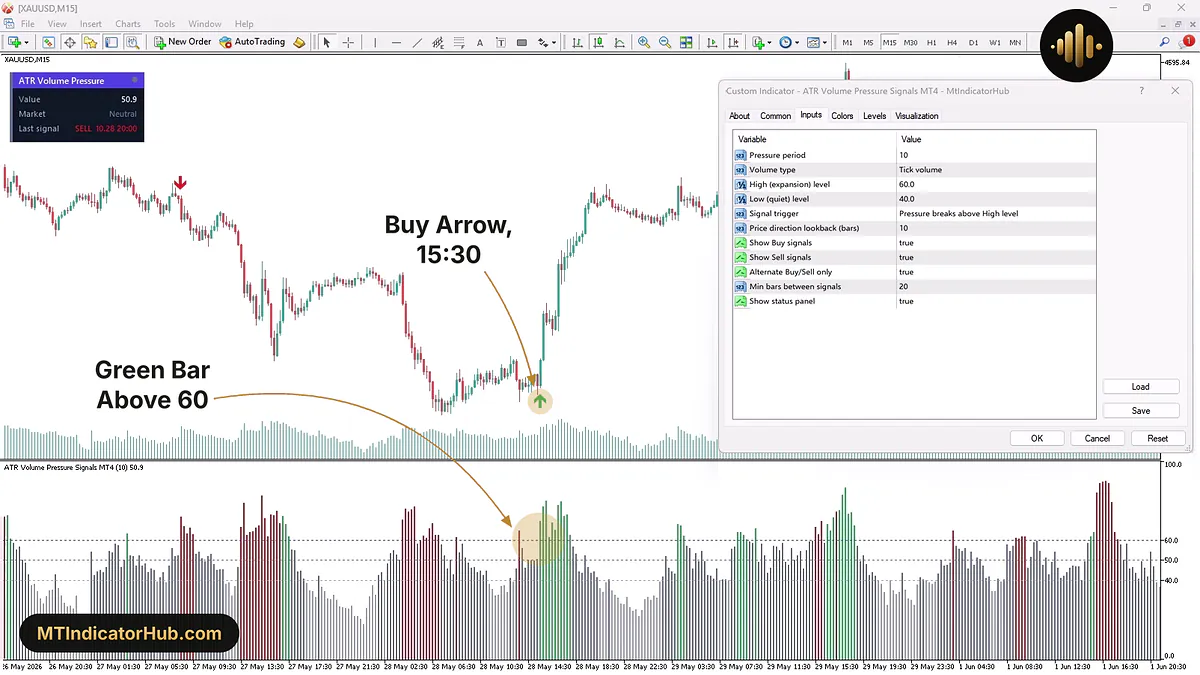
On the price chart, a Buy Arrow sits under the candle that lifted the score across 60 from underneath, as long as that candle also closed higher than the candle 10 bars earlier. In the subwindow, the same candle shows up as the first green bar of the move.
The XAUUSD M15 session of 28 May 2026 gives a clean case. Through the early afternoon the score stayed just under 50, with 49.7 at 14:45 and 49.8 at 15:00. The 15:30 candle then lifted it to about 69.5, the bar turned green and the Buy Arrow was drawn below that candle. The arrow before it was a Sell placed 120 candles back, so neither the 20-candle gap of Min bars between signals nor Alternate Buy/Sell only had anything to block.
The bars after it stayed green: 77.0 at 15:45, 79.7 at 16:00 and 79.3 at 17:15, while gold climbed from the 4402.25 open of the 15:45 candle to a 4480.25 high at 17:45. By 18:30 the score had eased to 53.2 and the bar was grey again.
For a long trade, the arrow candle supplies the reference points: entry at the following open, 4402.25, and a stop below the arrow candle's low near 4383.45, which leaves about 18.80 of risk. A return to grey under 60 marks the point where the expansion behind the arrow has faded.
Sell Signal
For a Sell Arrow the price side flips: the score crosses 60 on a candle that closes below the close of 10 candles earlier, so the bar comes out red and the arrow is drawn above the candle.
Early on 27 May 2026 the histogram started from quiet ground, at 39.3 on the 06:30 bar, light grey under the 40 line. At 08:30 it leapt to 71.8 as XAUUSD M15 fell from a 4507.16 open to a 4493.66 close, under the 06:00 candle's close of 4509.20, ten bars earlier. That red bar brought the Sell Arrow above the 08:30 candle.
Red bars held through 09:30, where the score was still 63.1, and price kept sliding to a 4424.96 low by 14:45. A short taken from this arrow would keep its stop above the arrow candle's high of 4508.65.
The next morning shows what alternation does. On 28 May at 04:00 the score reached 70.2 on a red bar, 74 candles on from that Sell Arrow and so well past the 20-candle minimum, yet no arrow appeared: with Alternate Buy/Sell only at true, a Sell can only follow a Buy, so the second red push stayed without a mark on the candles.
Indicator Settings
In MetaTrader 4 the Inputs tab shows all 11 settings as one list, without the group rows of the MT5 build.
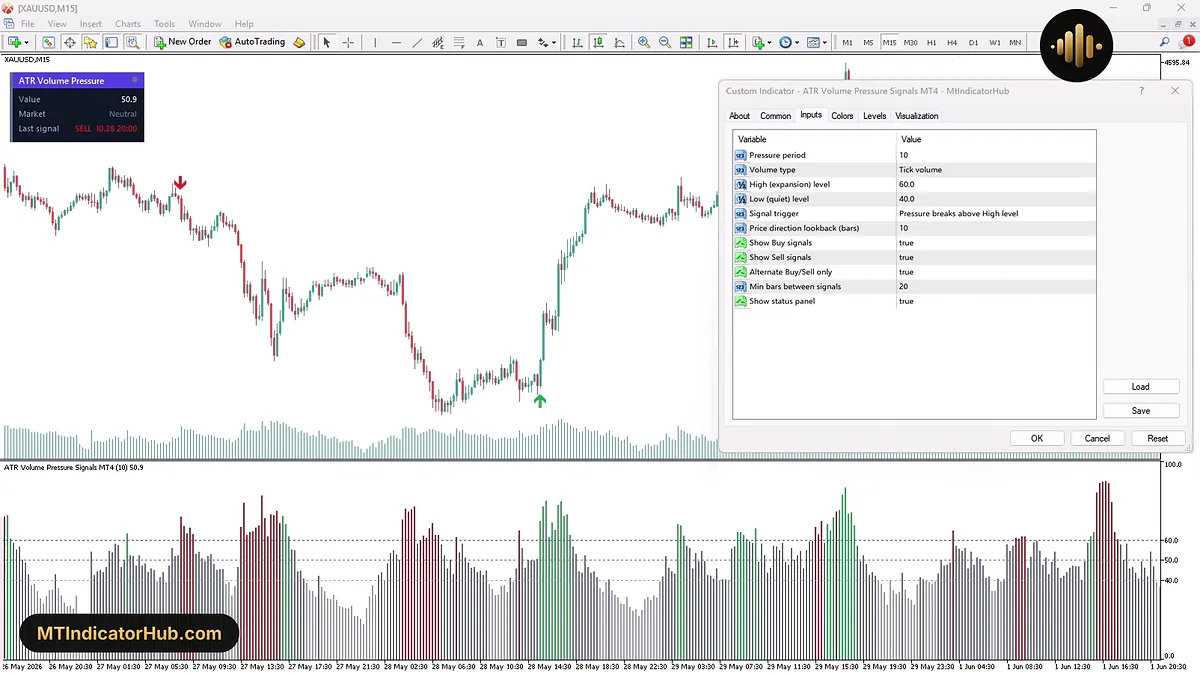
The first four inputs shape the histogram itself, the next six decide when an arrow appears and on which side, and Show status panel only turns the box on the chart on or off.
| Input | Default | What it changes |
|---|---|---|
| Pressure period | 10 | Number of candles behind the range and the pressure average |
| Volume type | Tick volume | Picks Tick volume or Real volume as the volume input |
| High (expansion) level | 60.0 | Score from which the panel switches to an expansion state and the bars colour green or red |
| Low (quiet) level | 40.0 | Score below which the panel switches to Quiet and the bars fade to light grey |
| Signal trigger | Pressure breaks above High level | The crossing that prints an arrow: over the High level, over 50, or back over the Low level |
| Price direction lookback (bars) | 10 | Candles back for the price comparison that picks Buy or Sell |
| Show Buy signals | true | Turns the Buy Arrows on or off |
| Show Sell signals | true | Turns the Sell Arrows on or off |
| Alternate Buy/Sell only | true | Lets a Buy follow only a Sell, and a Sell only a Buy |
| Min bars between signals | 20 | Fewest candles allowed between two arrows |
| Show status panel | true | Turns the Value, Market and Last signal box on or off |
Every count here is in candles, so the clock time moves with the chart: on M5, Pressure period 10 covers 50 minutes and the 20-candle gap lasts 1 hour 40 minutes, while on H4 the same 10 candles span 40 hours.
Conclusion
On MT4, the ATR Volume Pressure indicator answers one question for each closed candle: is the mix of range and volume speeding up, and is price leaning up or down against 10 candles ago? Its arrows mark only the first candle that carries that pressure past 60.
Since the decision waits for the close, an arrow always arrives one candle into the move, never ahead of it. The 10-candle price comparison is the only direction test, so the arrow says nothing about the larger trend around it. Each arrow also depends on the ones before it: at least 20 candles must pass, and while Alternate Buy/Sell only stays true, two expansions in a row on the same side produce a single arrow. No input on the list turns on a sound or pop-up alert, so new arrows are found by looking at the chart.
Your rating
Rate this indicator
How useful was this indicator? Click a star.
FAQ
Frequently asked questions
A plain ATR reports the average candle range in price units, so its value depends on the symbol. The ATR Volume Pressure indicator adds the traded volume to the range and then rates whether that combination is growing or shrinking, which puts every symbol on the same 0 to 100 scale, with its default lines at 40, 50 and 60.
Green and red bars both sit at 60 or higher; green means price is above its close of 10 candles before and red means it is below. Dark grey covers 40 to 60, where the panel reads Neutral, and light grey covers everything under 40, where it reads Quiet.
An arrow needs more than a high bar. With the default Signal trigger, the score has to cross 60 on that candle rather than stay above it, at least 20 candles must separate it from the previous arrow, and with Alternate Buy/Sell only set to true the previous arrow must point the other way.
Not always. The panel always describes the newest candle and the most recent arrow in the whole history, so on a chart scrolled back in time its Last signal row can name an arrow that is far to the right of the visible candles.






Comments
Be the first to comment.