


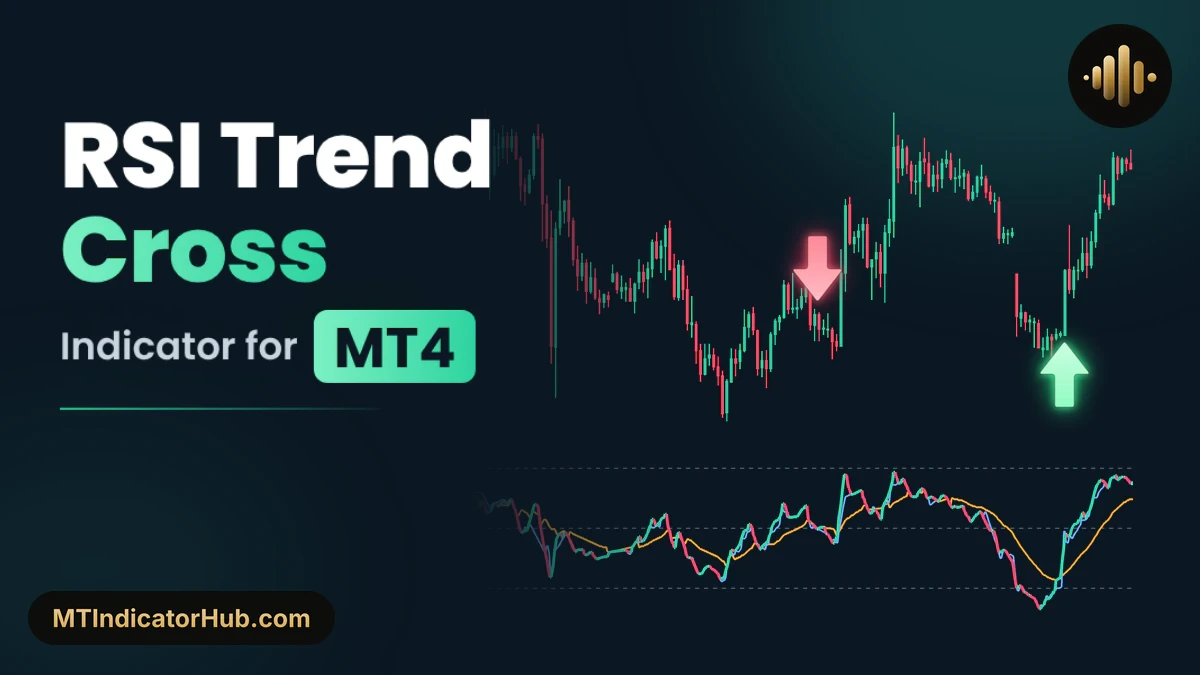
The RSI Trend Cross MT4 indicator draws a 14-period RSI in a subwindow and runs two smoothed lines along it, a quick blue one and a slower orange one. Their crossings decide where arrows land on the candles: a Buy Arrow when blue climbs over orange while orange sits below 50, and a Sell Arrow when blue slips under orange while orange sits above 50.
Runs a fast blue and a slow orange line along RSI 14 on MT4 and prints a Buy or Sell Arrow when they cross, filtered by the side of 50.
RSI Trend Cross Specifications
Everything the tool calculates stays in the subwindow below the candles, and an arrow is added to the chart only after the candle closes.
| Item | Details |
|---|---|
| Platform | MetaTrader 4 (MT4); also available for MT5 |
| Categories | Oscillators, Signal & Forecast |
| Indicator type | Trend, Overbought & Oversold, Entry Exit |
| Skill level | Intermediate |
| Timeframes | Any; shown here on M5 and M15 |
| Trading style | Scalper, Intraday |
| Markets | Forex, Commodities, Indices, Crypto, Stock (shown on XAUUSD) |
| Display | Subwindow with a thick RSI line (turquoise rising, red falling), a blue fast line, an orange slow line and dotted levels at 70, 50 and 30; arrows over and under the candles; corner panel with the rows RSI / Market / Signal |
| Alerts | Alert on new signal input, false by default |
| Version | 1.0 |
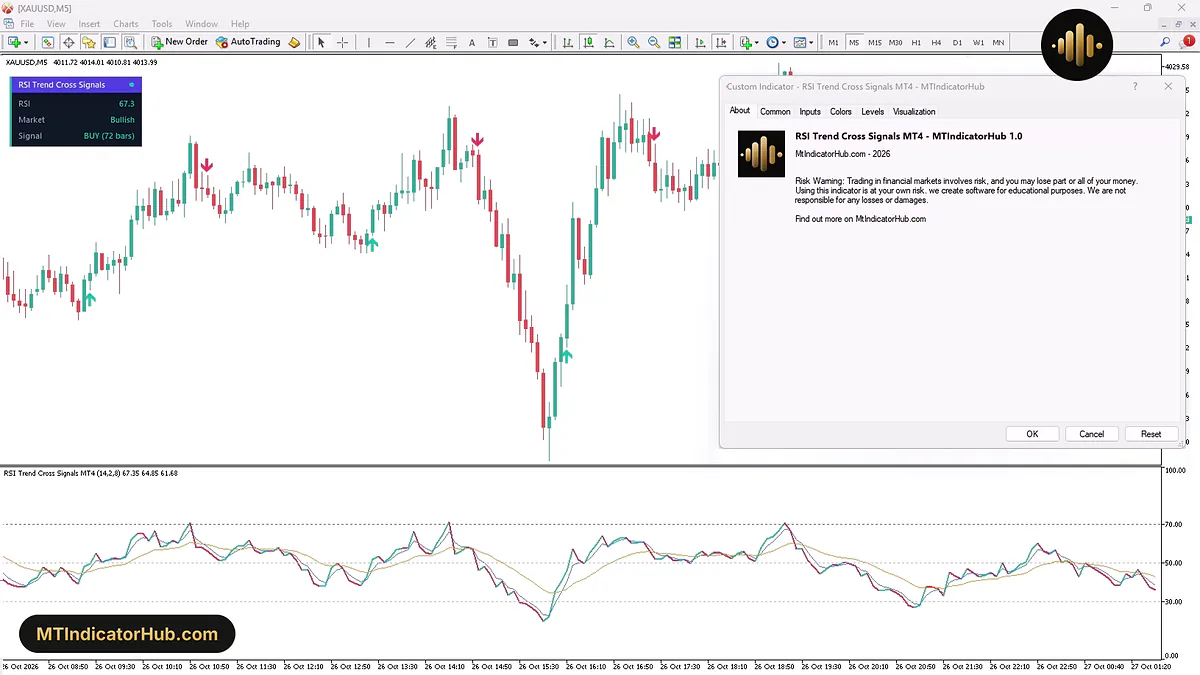
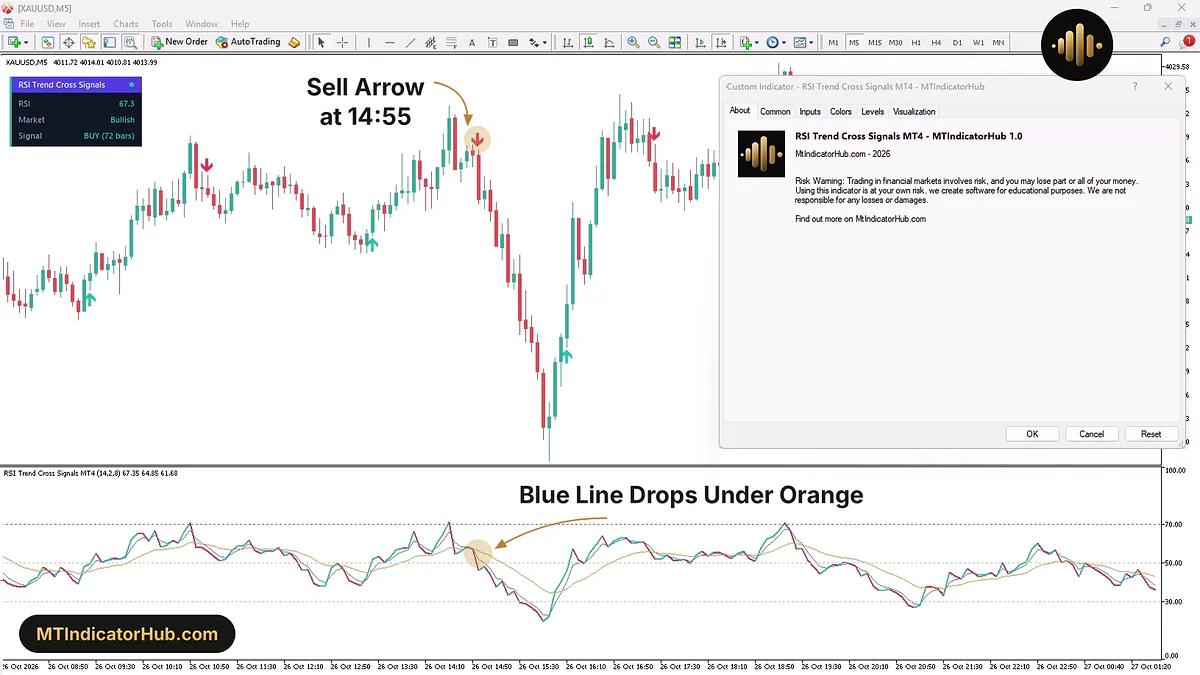
The image shows the About tab of the Custom Indicator window open over XAUUSD M5. Behind it, the corner panel lists 67.3 for RSI, Bullish for Market and BUY (72 bars) for Signal, and the subwindow's title line, RSI Trend Cross Signals MT4 (14,2,8), ends with 67.35, 64.85 and 61.68, the readings of the RSI, the blue line and the orange line.
What Is the RSI Trend Cross Indicator?
The RSI Trend Cross indicator works as an RSI crossover tool for MT4 built on one reading: the RSI of the 14 most recent closes, which runs from 0 to 100. Rather than judging that reading against fixed levels alone, it compares the RSI with two smoothed copies of itself, the idea of a moving average crossover applied to momentum instead of price. The fast copy averages just 2 periods and hugs the RSI; the slow copy averages 8 and trails behind. Blue above orange means the RSI is running stronger than its recent average, blue below orange that it is falling behind it.
Colour carries two kinds of information in the subwindow. The thick RSI line changes with its own direction, turquoise for each candle on which it climbed and red for each one on which it fell back, while the blue fast line and the orange slow line keep one colour each. Dotted levels mark 70 for Overbought, 50 for the middle and 30 for Oversold.
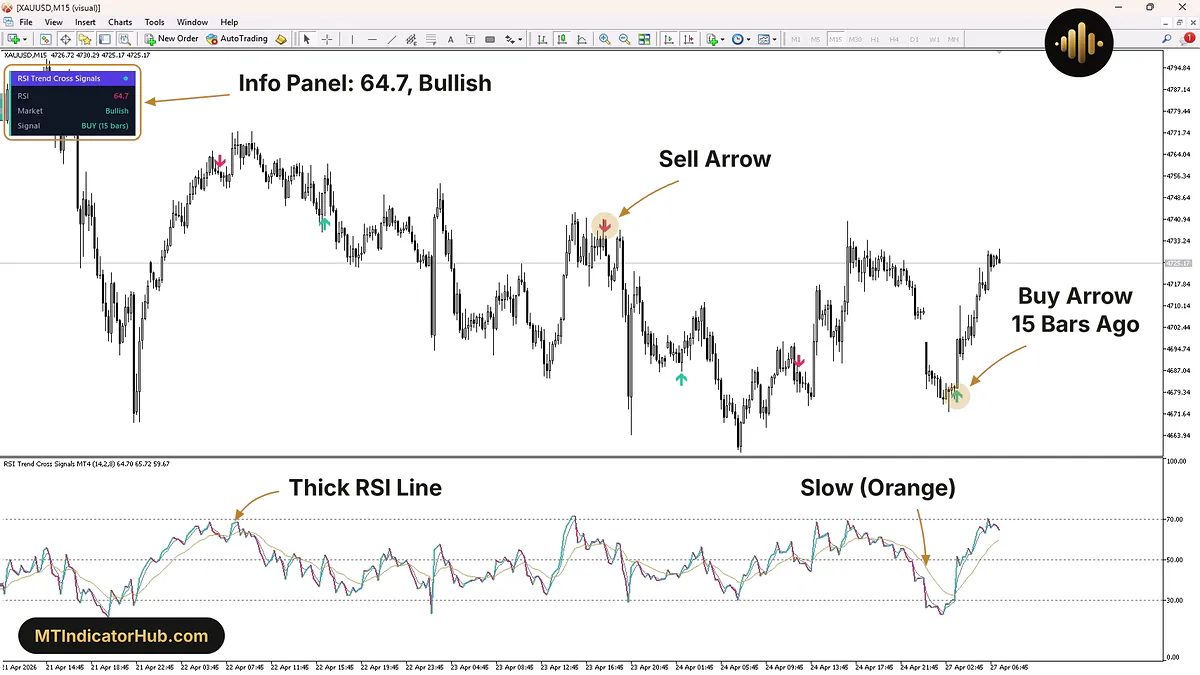
The panel in the corner of the chart, titled RSI Trend Cross Signals, sums up the state in three rows. RSI holds the latest value. Market reads Bullish or Bearish depending on whether blue stands above or below orange, Neutral when they match, and adds OB beyond 70 or OS beyond 30. Signal tells which way the latest arrow pointed and how old it is in candles, for example BUY (72 bars).
The tester run below, on XAUUSD M15 between 21 and 27 April 2026, shows three sells and three buys following each other.
Buy Signal
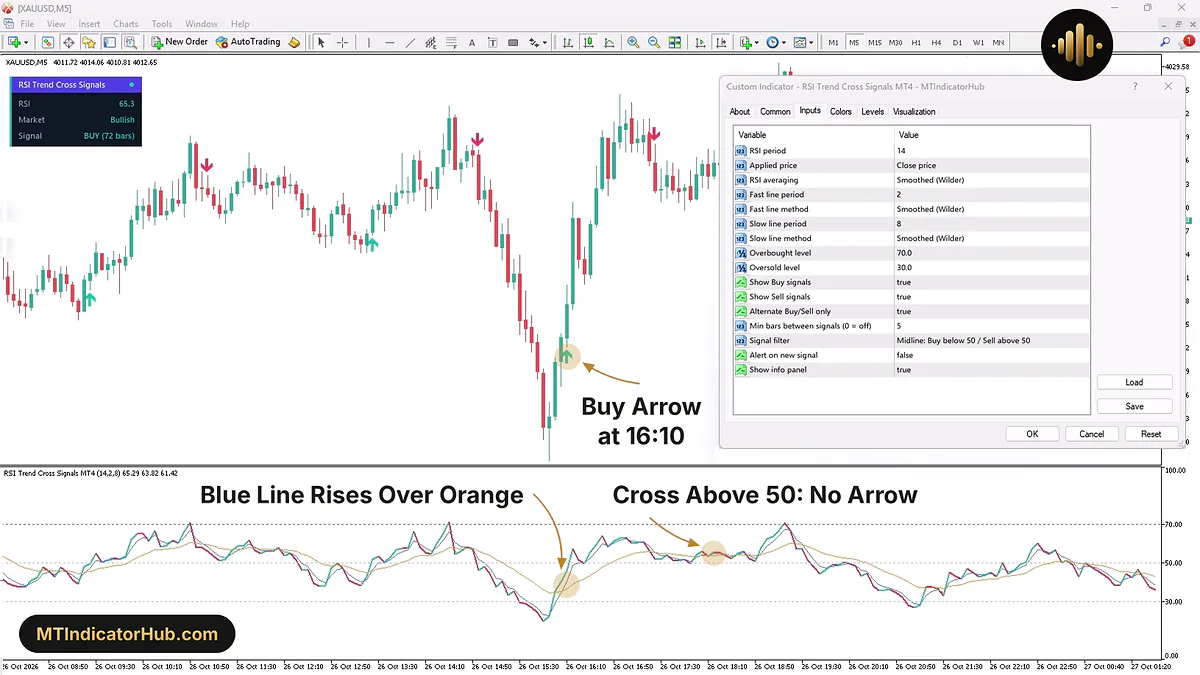
With the default settings, a Buy Arrow depends on two things on a closed candle: blue ends above orange, and orange is under 50 at that moment, which is what Signal filter: Midline: Buy below 50 / Sell above 50 asks for. The arrow sits below that candle's low.
The 16:10 candle of 26 October 2026 on XAUUSD M5 is a clear case. The RSI had bottomed at 20.17 on the 15:50 candle and was climbing through 35.48 (16:00) and 40.29 (16:05) to 45.95 (16:10). Blue was still a hair under orange at 16:05, about 34.5 against about 35.3. One candle later blue stood near 40.4 and orange near 36.4, so the two had crossed with orange well under the midline, and the Buy Arrow appeared below that candle (open 4001.44, low 4000.50, close 4004.90).
The other settings had no reason to hold it back. The arrow before it, a Sell at 14:55, was 15 candles old, longer than the 5-candle minimum, and it pointed the other way.
For a long position, a stop under 4000.50, the low of the arrow candle, sits 4.40 below its close, while the 3988.73 low of 15:55 is the wider choice. By 16:55 price had reached about 4026.72, about 21.82 over the 4004.90 close. The Sell Arrow of 17:25, 15 candles after the buy, is where the indicator itself turned the other way.
Later that afternoon, at 18:15, blue moved over orange again, about 54.9 against about 53.8. No arrow followed this time: orange was above 50, and Midline accepts only sells on that side. Setting Signal filter to No filter (every cross) would remove that check.
Sell Signal
The sell side mirrors it: blue closes a candle below orange while orange is still above 50, and the arrow goes over the candle's high.
On the same chart, the arrow before that buy printed at 14:55. The RSI had reached 70 at 14:30, the candle where price topped near 4025.51, and read 57.33 by 14:50. The 14:55 candle then went from 4020.41 to 4015.83, with a high of 4020.96 and a low of 4015.38, and in that single candle the RSI lost 11.09 points, to 46.24. Blue dropped to about 51.9 while orange held about 56.0, still above 50, and the arrow was placed above the 4020.96 high. The previous arrow, a Buy at 13:25, was 18 candles back.
Over the next hour the decline kept going. The RSI was down to 20.17 at 15:50, below the Oversold line, and price made a low of 3988.73 at 15:55, 27.10 under the 4015.83 close.
A stop above the 4020.96 high is 5.13 from that close; above the 14:30 peak it is about 9.68. From the indicator's side the move ended at the 16:10 Buy Arrow, where blue crossed back over orange below 50.
Indicator Settings
MetaTrader 4 lists all 16 inputs of RSI Trend Cross Signals MT4 in one column, with no group headers.
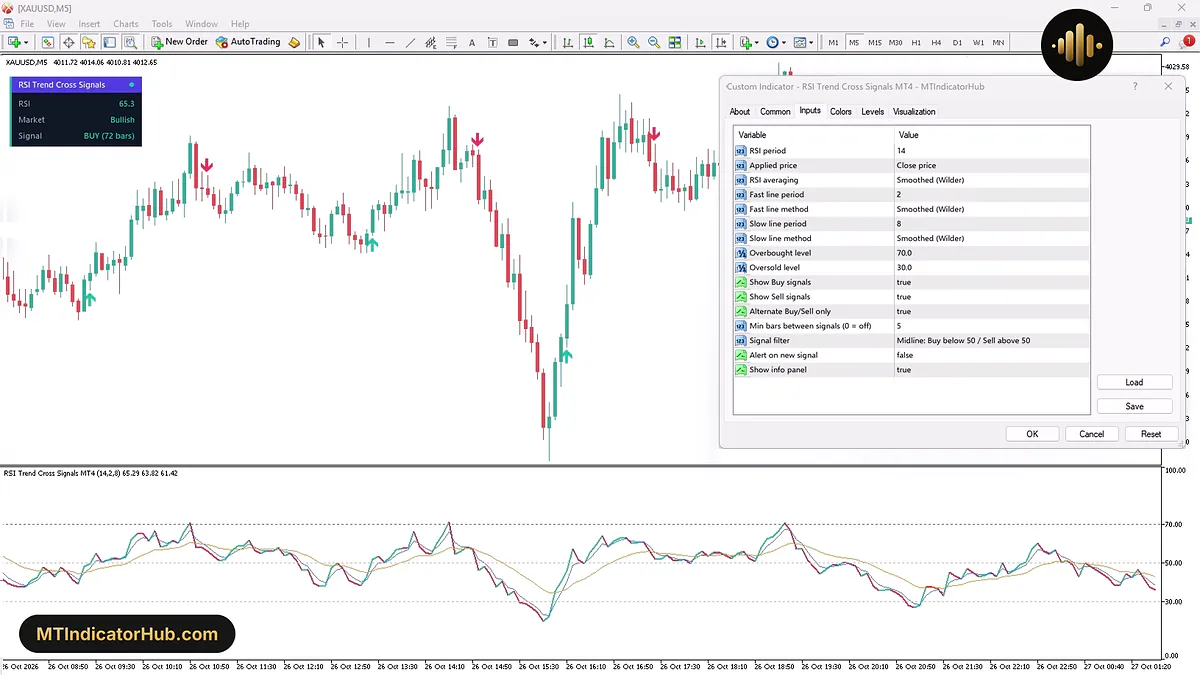
Three lists open on Smoothed (Wilder), the smoothing used in the original RSI: RSI averaging for the RSI itself, which offers four modes, and Fast line method and Slow line method for the two lines. Signal filter has three entries, No filter (every cross), Midline: Buy below 50 / Sell above 50 and Extreme: RSI recently touched OB/OS.
| Input | Default | What it changes |
|---|---|---|
| RSI period | 14 | Length of the RSI in candles |
| Applied price | Close price | Candle price the RSI reads |
| RSI averaging | Smoothed (Wilder) | Method behind the RSI reading |
| Fast line period | 2 | Candles counted for blue |
| Fast line method | Smoothed (Wilder) | Smoothing type for blue |
| Slow line period | 8 | Candles counted for orange |
| Slow line method | Smoothed (Wilder) | Smoothing type for orange |
| Overbought level | 70.0 | Top dotted level; Market adds OB above it |
| Oversold level | 30.0 | Bottom dotted level; Market adds OS below it |
| Show Buy signals | true | false hides every Buy Arrow |
| Show Sell signals | true | false hides every Sell Arrow |
| Alternate Buy/Sell only | true | Buy and Sell Arrows take turns |
| Min bars between signals (0 = off) | 5 | Shortest gap between arrows, in candles; 0 turns it off |
| Signal filter | Midline: Buy below 50 / Sell above 50 | Looks at the side of 50, at a recent visit to 30 or 70, or at nothing |
| Alert on new signal | false | true sends an alert with each new arrow |
| Show info panel | true | Turns the corner panel on or off |
On M15, the timeframe of the tester run, the 14-candle RSI spans 3 hours 30 minutes and the orange line 2 hours, and a 5-candle gap lasts 1 hour 15 minutes; on M5 that gap is 25 minutes.
Conclusion
RSI Trend Cross for MT4 reduces the RSI to one question: has the quick blue line just passed the slower orange one, and on which side of 50 is orange? The answer becomes a Buy or Sell Arrow on the closed candle.
That clarity comes with delay. Both lines are averages of the RSI, so a crossing confirms a turn that has already started, and the arrow also needs the candle to close. Near 50 the lines can cross several times in a row; Midline, Alternate Buy/Sell only and the 5-candle gap thin those crossings out, which also means some real turns get no arrow at all. With Alert on new signal left at false the tool stays silent, and the Signal row keeps counting from the live candle even when the chart has been scrolled back.
Your rating
Rate this indicator
How useful was this indicator? Click a star.
FAQ
Frequently asked questions
A single line would cross the RSI on almost every candle. The fast line, 2 periods long, stays close to the RSI and the slow line, 8 periods long, reacts later, so their crossing marks a change in momentum that has held for a few candles. Both lengths and both averaging methods can be changed among the inputs.
It stops crossings that happen on the far side of 50 for their direction. Blue rising over orange earns a Buy Arrow only while orange is below 50, and blue falling under orange earns a Sell Arrow only while orange is above 50. On XAUUSD M5 at 18:15 on 26 October 2026, blue rose over orange with orange near 53.8, so that crossing passed without an arrow.
They describe the two lines, not price. The Market row reads Bullish while blue is above orange, Bearish while blue is below and Neutral when they meet, with OB or OS added when the RSI is past 70 or 30. Because the arrow filters do not apply to this row, it can turn Bullish on a crossing that gets no Buy Arrow.
At least 5 by default, set by Min bars between signals; 0 removes that limit. Alternate Buy/Sell only adds a second rule, so a new arrow must also face the opposite direction from the last one. In the M5 example the 16:10 buy came 15 candles after the 14:55 sell, and the 17:25 sell another 15 candles later.






Comments
Be the first to comment.