


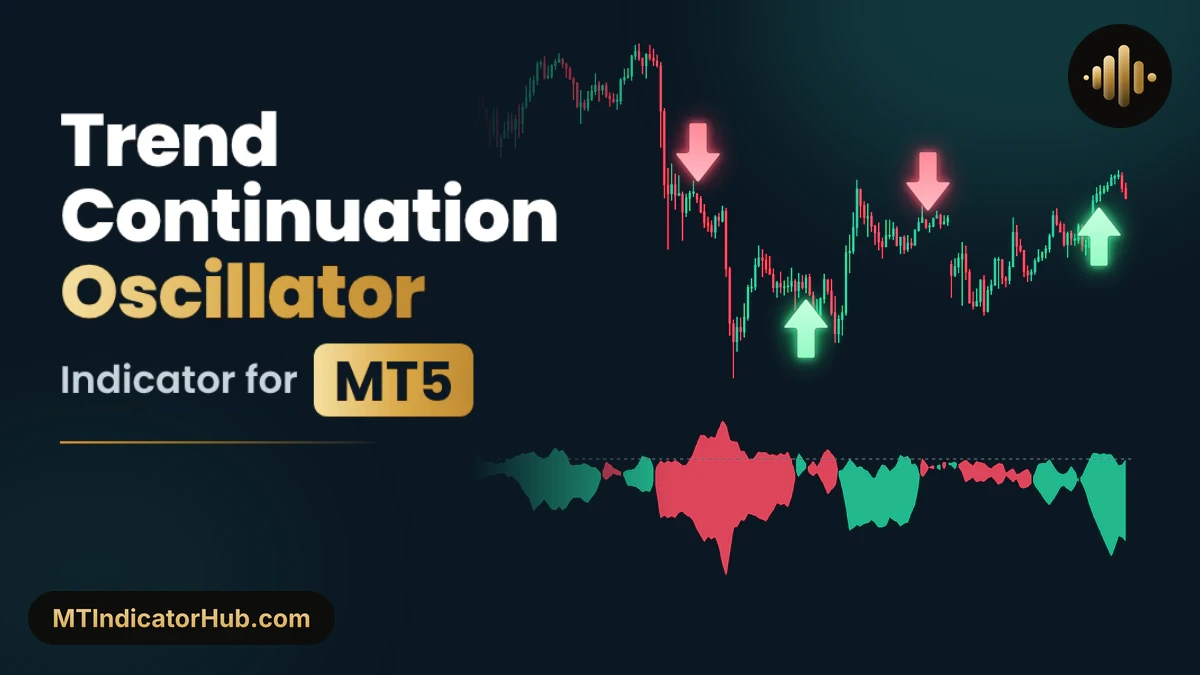
The Trend Continuation Oscillator MT5 indicator measures how much follow-through is left in the current move with two lines, Bull Continuation and Bear Continuation, drawn in a window under the chart with a green or red fill between them. A Buy Arrow appears under the candle on which the Bull Continuation line climbs from below zero to above it, and a Sell Arrow appears over the candle on which the Bear Continuation line makes the same climb.
Two lines, Bull and Bear Continuation, filled green or red, with a Buy or Sell arrow on the candle where one of them climbs above zero.
Trend Continuation Oscillator Specifications
Trend Continuation Oscillator Signals MT5 keeps both lines in their own window and checks for arrows only on candles that have closed.
| Item | Details |
|---|---|
| Platform | MetaTrader 5 (MT5); also available for MT4 |
| Categories | Oscillators, Signal & Forecast |
| Indicator type | Trend, Entry Exit |
| Skill level | Beginner |
| Timeframes | Any; shown here on M5 and M15 |
| Trading style | Scalper, Intraday |
| Markets | Forex, Commodities, Indices, Crypto, Stock (shown on XAUUSD) |
| Display | Bull Continuation and Bear Continuation lines with a green or red fill and a dotted zero line, drawn below the price chart; Buy Arrows under and Sell Arrows over the candles; info panel (Value, Market, Last Signal) |
| Alerts | None |
| Version | 1.0 |
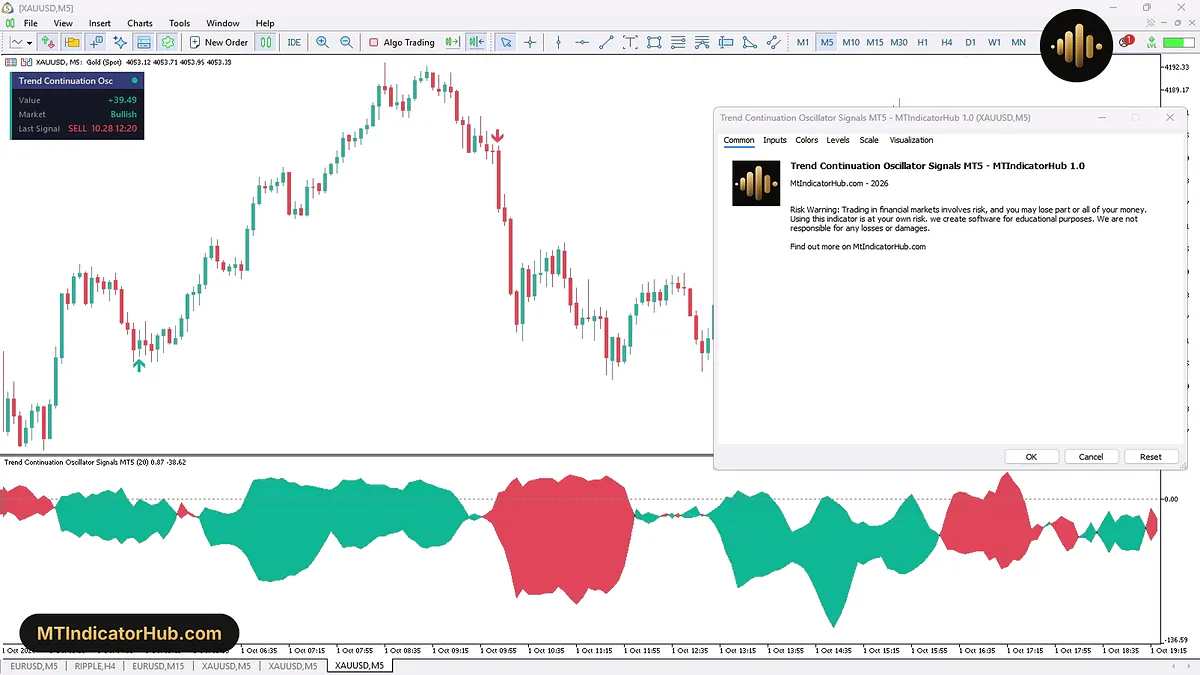
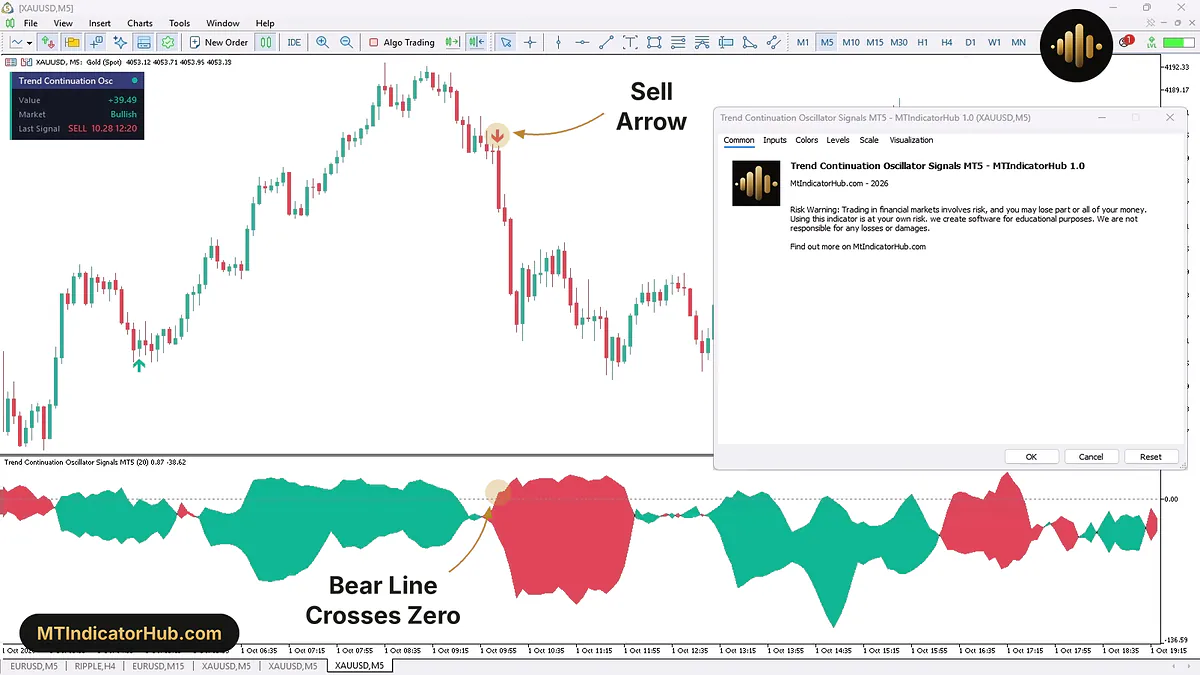
The XAUUSD M5 chart behind the Common tab has its info panel near the top-left corner, reading Value +39.49 and Market Bullish. Below the candles, the indicator window swings between green and red areas around its dotted zero line.
What Is the Trend Continuation Oscillator Indicator?
The Trend Continuation Oscillator is a trend continuation indicator for MetaTrader 5, built from two lines, that asks whether the current market trend is still being carried forward. It follows price candle by candle: when the close keeps rising, or keeps falling, several candles in a row, it adds those back-to-back moves together and weighs them over the last 20 candles, the default Oscillator period. Two values come out of it: Bull Continuation for the strength of the upward run and Bear Continuation for the strength of the downward one.
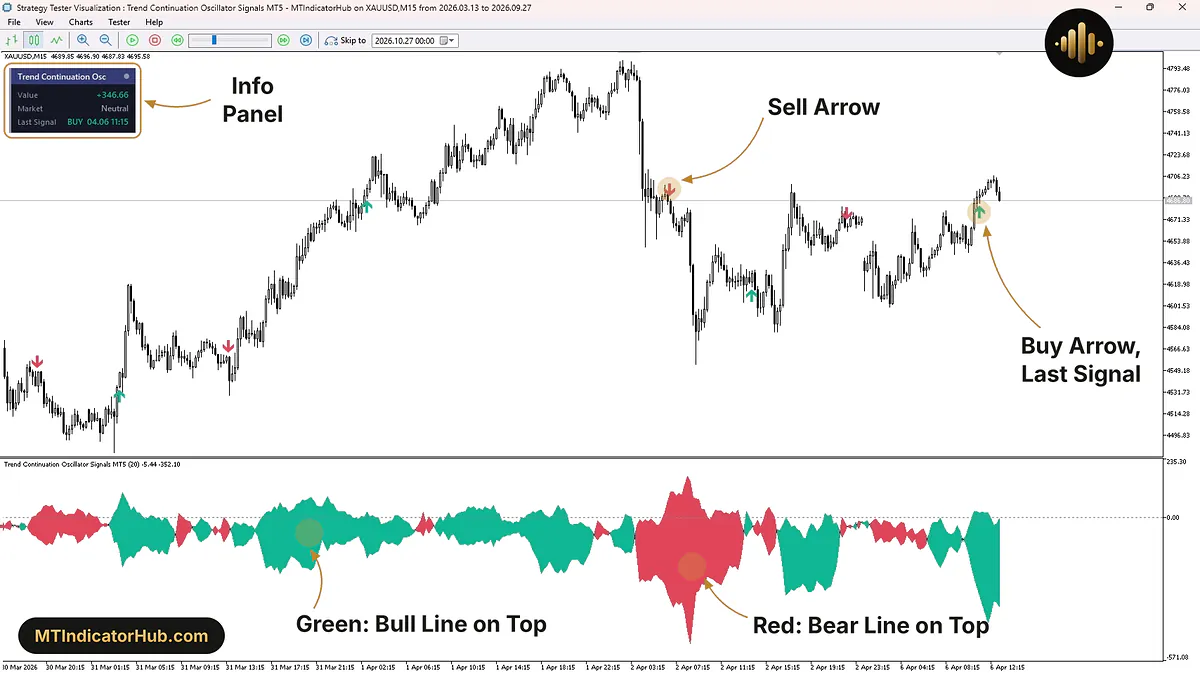
Both lines share a separate window under the price chart, and the space between them is filled:
- green while Bull Continuation is the higher line, so the rise is the stronger side;
- red while Bear Continuation is the higher line, so the fall is the stronger side.
A dotted line at 0.00 separates positive readings from negative ones. That line, not the fill colour, is what the arrows watch.
The info panel, titled Trend Continuation Osc, has three rows. Value is how far apart the two lines are on the newest candle, Bull Continuation minus Bear Continuation. Market reads Bullish while the Bull Continuation line is above zero, Bearish while the Bear Continuation line is above zero, and Neutral when both stay below it. Last Signal records the newest arrow with its side, date and time, for example BUY 04.06 11:15. The Data Window places both readings under Indicator window 1; the label of the lower window repeats them after Trend Continuation Oscillator Signals MT5 (20).
Below, in the Strategy Tester, the panel shows Value +346.66 and still says Neutral, because both lines are below zero.
Buy Signal
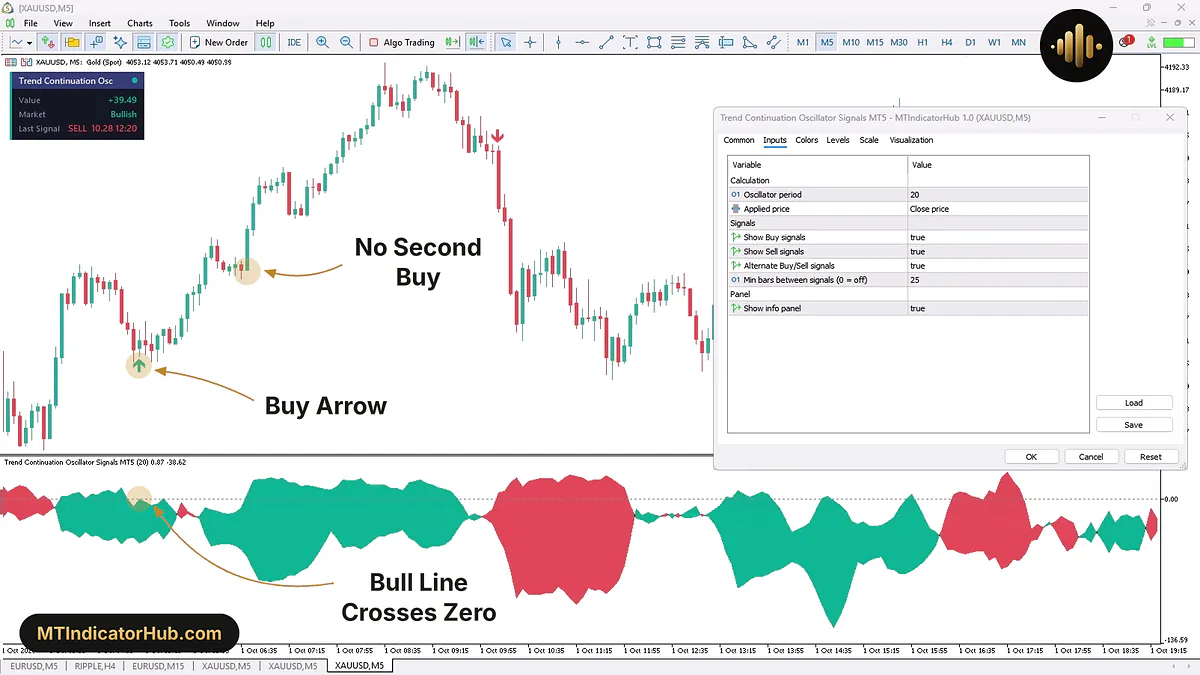
A Buy Arrow is printed under the candle that lifts the Bull Continuation line from below zero to above it. A green fill on its own is not enough; the arrow waits for that zero crossing on a closed candle.
On XAUUSD M5 on 1 October 2026, Bull Continuation read -7.05 on the 05:05 candle and 0.64 on the 05:10 candle. The Buy Arrow was printed under that 05:10 candle, which opened at 4153.30, traded between 4155.84 and 4152.21, and closed at 4154.33. Bear Continuation sat far lower, near -41, which kept the fill green.
Twice more that morning the Bull line climbed back over zero without a second Buy Arrow: at 05:30 with 0.79, four candles after the arrow, and at 06:40 with 4.77, 18 candles after it. Both came before the 25 candles required by Min bars between signals had passed, while Alternate Buy/Sell signals, set to true, meant the next arrow had to be a Sell in any case.
From 06:40 the Bull line held above zero until about 09:35, and gold rose to about 4193.01 on the 08:35 candle, about 38.68 above the 05:10 close.
Taken as a long, the trade levels come straight from the 05:10 candle: an entry on the candle after its 4154.33 close and a stop under its 4152.21 low, 2.12 lower. The Bull line itself shows when the push is spent. Once it drops back below zero, as it had by 09:45 with -15.47, the upward continuation behind the arrow is gone.
Sell Signal
On the sell side the trigger moves to the other line: a Sell Arrow goes over the candle on which Bear Continuation rises from below zero to above it. The fill can turn red a few candles earlier, as soon as Bear Continuation overtakes Bull Continuation under zero, but the arrow still waits for the zero line.
The same XAUUSD M5 chart shows it five hours after the Buy Arrow. The fill was already red at 10:00, while Bear Continuation stayed under zero, about -6.9 at 10:05. On the 10:10 candle it reached about +6.9 as Bull Continuation fell from -23.30 to -36.02, and the candle opened at 4180.69 and closed at 4172.69, 8.00 lower. The previous arrow was the 05:10 Buy, 60 candles back, so neither filter held this one, and the Sell Arrow appeared over the 10:10 candle.
The red area widened after that. The Bear line stayed above zero until about 11:55, the Bull line was down at -93.88 by 11:10, and the 11:45 candle dipped to about 4148.93, roughly 23.76 under the 10:10 close.
To trade it short, the stop can go above 4181.41, the high of the 10:10 candle and 8.72 over its close. A Bear line slipping back under zero, as it did near 12:00, is the sign that the downward continuation has run out.
Indicator Settings
The Inputs tab holds seven settings in three groups: Calculation, Signals and Panel.
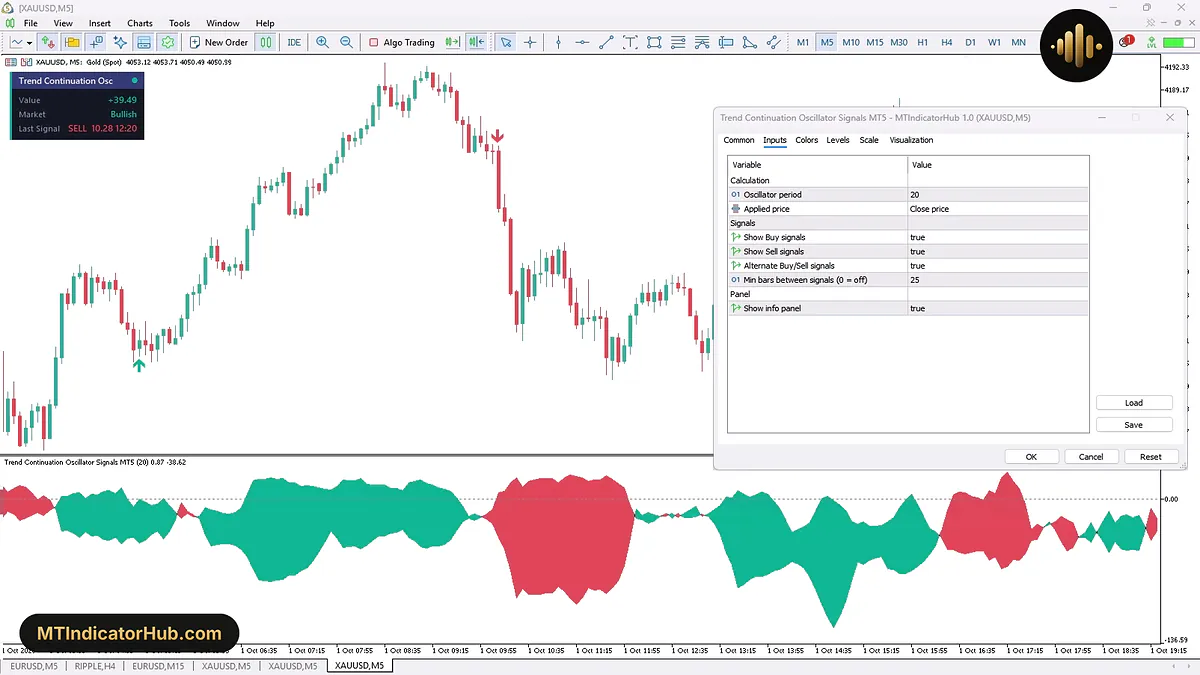
Oscillator period and Applied price, the two Calculation inputs, shape both lines, while the four Signals inputs only decide which arrows reach the chart. The 01 icon marks the two whole-number inputs and a list icon marks Applied price; every other input is a true or false choice.
| Input | Default | What it changes |
|---|---|---|
| Calculation: how the two lines are built | ||
| Oscillator period | 20 | Candles the lines are weighed over; a smaller number reacts faster with more arrows, a larger one is smoother with fewer |
| Applied price | Close price | The price of each candle the moves are measured on |
| Signals: which arrows appear and how often | ||
| Show Buy signals | true | Keeps or removes the Buy Arrows under the candles |
| Show Sell signals | true | Keeps or removes the Sell Arrows over the candles |
| Alternate Buy/Sell signals | true | Forces the arrows to alternate between the two sides |
| Min bars between signals (0 = off) | 25 | Smallest gap, in candles, from one arrow to the next; 0 turns the gap off |
| Panel: the box in the chart corner | ||
| Show info panel | true | Keeps the three-row box on screen, or leaves the chart without it |
Oscillator period and Min bars between signals count candles, not minutes. On M5, Oscillator period 20 covers 1 hour 40 minutes and the 25-candle gap lasts 2 hours 5 minutes; on M15 the same values span 5 hours and 6 hours 15 minutes.
Conclusion
The Trend Continuation Oscillator MT5 indicator checks every finished candle for one thing: whether rises or falls are still being followed through. It marks the candle where one side's continuation line first crosses above zero, with a Buy Arrow for the Bull line and a Sell Arrow for the Bear line.
Each arrow is settled when its candle finishes, which puts it a little behind the move it marks. The zero line is the only trigger, so a fill colour alone never prints an arrow, and when both lines sit under zero the panel stays on Neutral however large the Value is. With Alternate Buy/Sell signals on, a second push in the same direction is left unmarked, while Min bars between signals holds every arrow 25 candles or more from the last one. There is no alert setting among the seven inputs, so a fresh arrow shows up only as a mark on the candles. When the view is dragged back to older candles, the panel keeps reporting the newest one, not the bars in sight.
Your rating
Rate this indicator
How useful was this indicator? Click a star.
FAQ
Frequently asked questions
They show which of the two lines is on top. Green means Bull Continuation is above Bear Continuation, so the rising side is carrying more strength; red means the falling side is. The colour can change many times without an arrow, because arrows come only from a line crossing the dotted zero line.
Value is the distance between the lines, Bull Continuation minus Bear Continuation, while the Market row looks at where each line sits against zero. In our Strategy Tester example the lines were at -5.44 and -352.10: a Value of +346.66, yet both lines were negative, so Market read Neutral.
A zero crossing is only the first condition. At the defaults, at least 25 candles must pass after the previous arrow. Also, while Alternate Buy/Sell signals is true, a Buy can only follow a Sell. On XAUUSD M5 on 1 October 2026 the Bull line crossed zero again at 06:40, 18 candles after a Buy, so neither condition was met.
It is the number of candles over which the back-to-back moves are weighed. The default 20 equals 1 hour 40 minutes on M5. A lower number makes both lines react sooner and brings more arrows; a higher number smooths them and leaves fewer arrows on the chart.






Comments
Be the first to comment.