


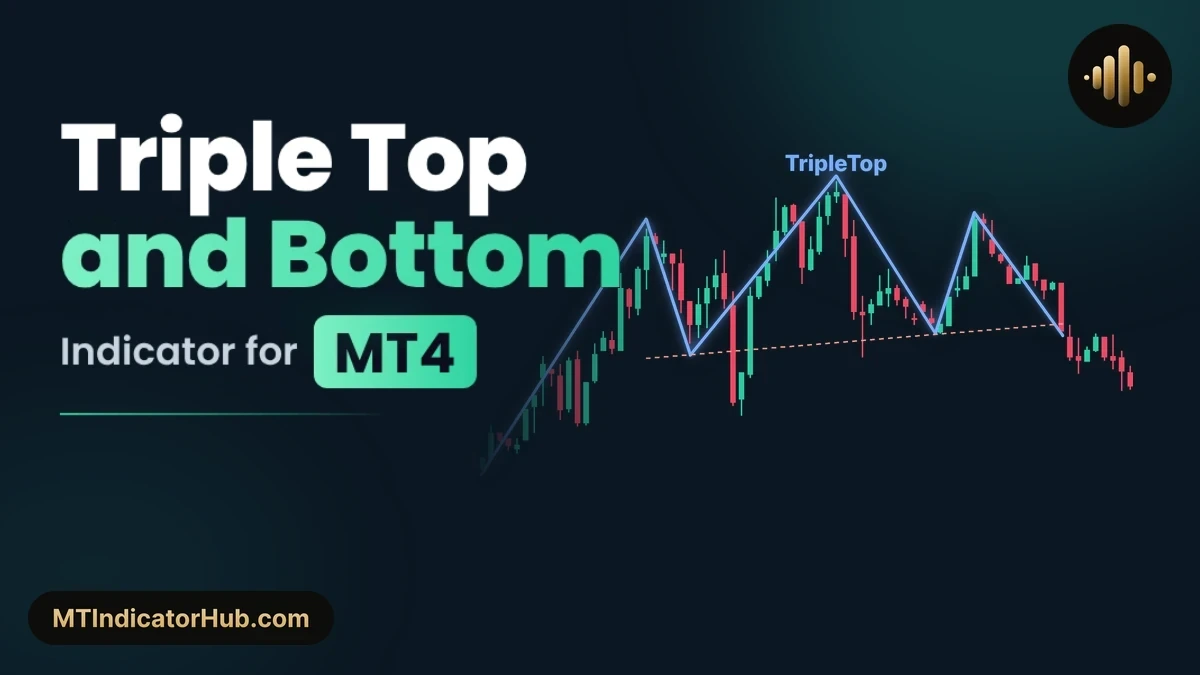
On MetaTrader 4, the Triple Top and Bottom indicator follows the swing points of its own zigzag and marks each place where price turned three times at almost the same level. A triple top is drawn in blue with the word TripleTop, a triple bottom in salmon with TripleBottom, and both get a dotted neckline through the two swings between the turns.
On MT4, marks three turns at almost one price as a blue TripleTop or a salmon TripleBottom, with a dotted neckline through the swings between them.
Triple Top and Bottom Specifications
All of it lives on the main price chart: there is no separate indicator window and no information panel.
| Specification | Detail |
|---|---|
| Platform | MetaTrader 4 (MT4); an MT5 version is available too |
| Categories | Price Action |
| Indicator type | Chart patterns, reversal |
| Skill level | Beginner |
| Timeframes | Any; shown here on M5 |
| Trading style | Intraday, swing trading |
| Markets | Forex, gold, indices, crypto, stocks |
| Display | Blue TripleTop or salmon TripleBottom lines with a label and a dotted neckline; optional dash-dot zigzag |
| Alerts | None |
What Is the Triple Top and Bottom Indicator?
A triple top is three highs at nearly one price with two pullbacks between them; a triple bottom turns that upside down, three lows with two rebounds. The indicator takes both from its zigzag. Every swing high and swing low the zigzag confirms becomes a candidate, and three neighbouring highs, or three neighbouring lows, are checked against each other.
How close counts as close is set by Proximity Factor, in units of the Average True Range. At the default of 0.5, each high may sit no more than half an ATR from the next one, and the two pullbacks between them have to pass the same test; a triple bottom is held to the same limit for its lows and rebounds. The default is deliberately tight, so it finds few shapes, and the ones it does find look like the textbook pattern.
A shape that passes is joined with solid lines, from the swing before the first turn to the candle that crosses back over the neckline. The tool writes TripleTop above the middle high or TripleBottom below the middle low and runs a thin dotted neckline through the two inner swings. The zigzag stays hidden by default; set Show Zig Zag Line to true and it appears as a turquoise dash-dot line, so the swings behind each pattern can be checked by eye. Removing the indicator takes every line, label and neckline off the chart with it.
Bullish Pattern
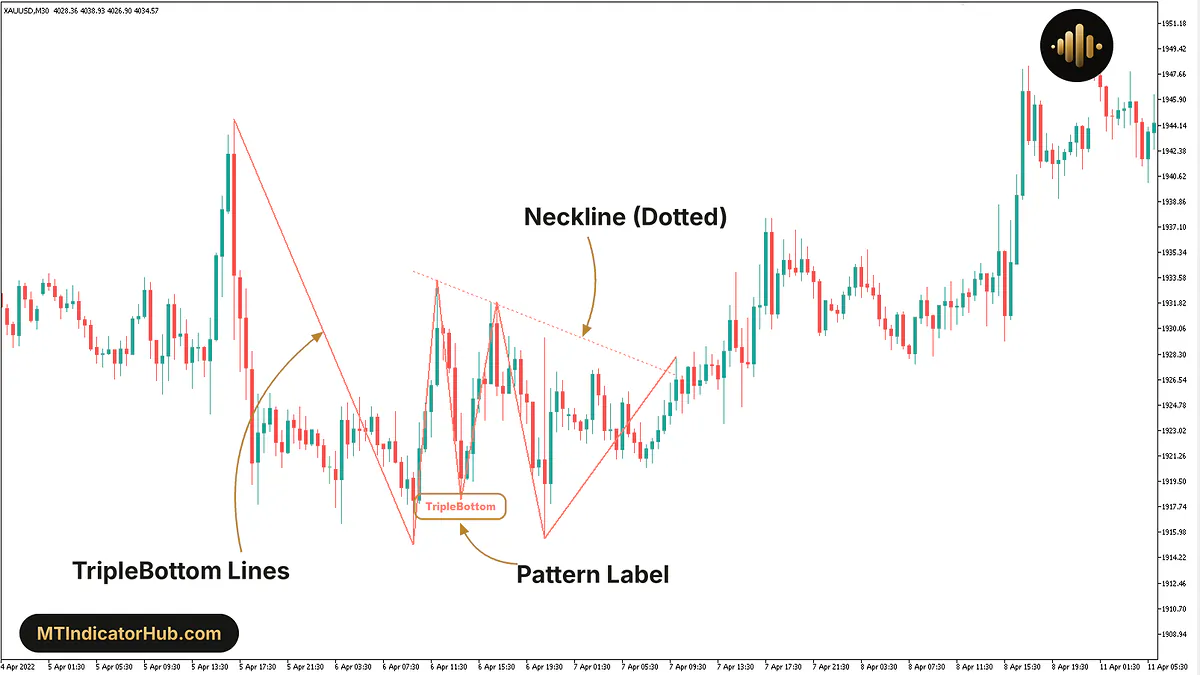
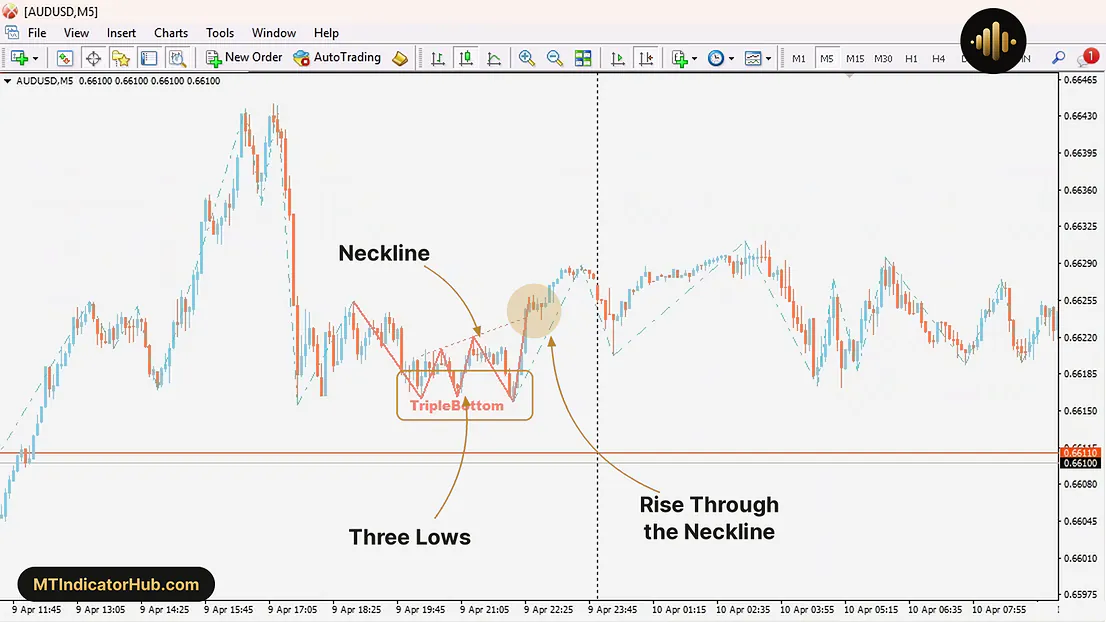
The bullish shape is the triple bottom: price falls to roughly the same low three times and cannot get under it. The two rebounds between the lows set the neckline and its slope, and the salmon lines run from the swing high before the first drop until a candle lifts price above that neckline.
On 9 Apr, AUDUSD on M5 slid from about 0.66253 at 18:50 to a first low near 0.66162 around 20:15. A bounce to 0.66208 came next, then a second low near 0.66164 at 21:00, a lift to 0.66220 and a third low near 0.66160 at about 22:10. Less than half a pip separates the three lows, close enough for the default factor of 0.5. The neckline climbs through the two rebound highs; price was back at it near 0.66239 at 22:25 and traded around 0.66283 by 23:15.
For a long idea, the neckline is the level price has to clear, and the lowest of the three lows, about 0.66160 on this chart, is where the pattern would stop making sense.
Bearish Pattern
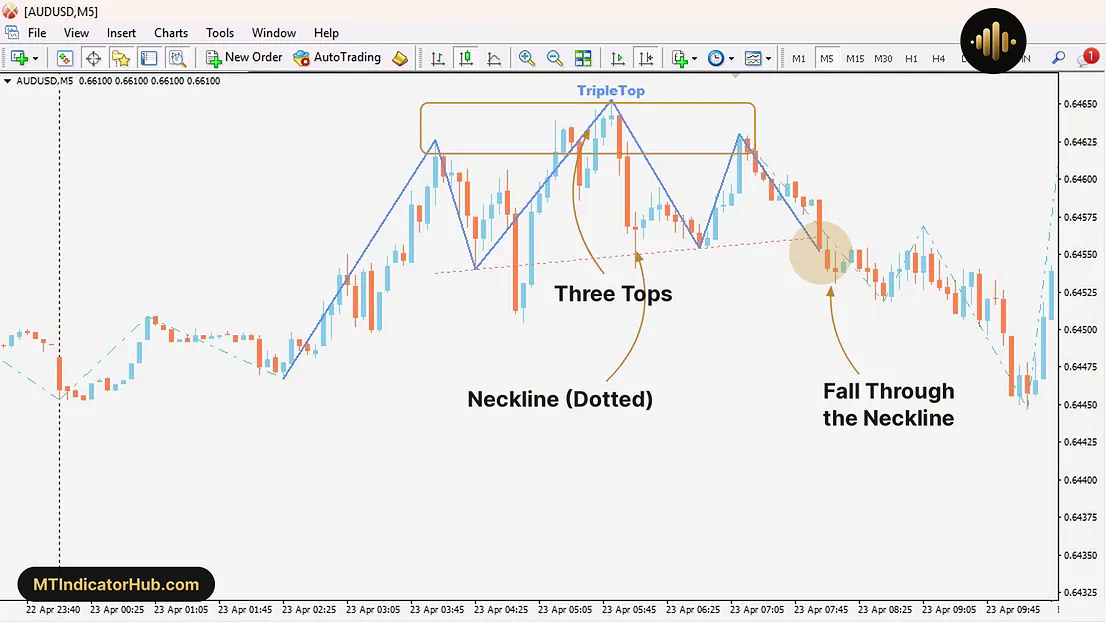
A triple top is the same idea pointing down: three rallies stall at almost one price, and the neckline runs beneath the two pullbacks that separate them.
This example on 23 Apr was taken with Proximity Factor raised to 1.5. Highs came near 0.64625 at 04:00, 0.64652 at 05:50 and 0.64629 at 07:10, with pullbacks to 0.64541 and 0.64554 in between. The blue lines follow that path and stop near 08:00, where price slipped back under the dotted neckline around 0.64559; by about 10:05 a candle had dipped to about 0.64450.
The factor is the edge case on this side. At 1.5 the tool accepts turns up to one and a half ATR apart, so more tops and bottoms show up, and some of them only loosely resemble three equal turns. Raise it only as far as the shapes on your chart still look like the pattern. For a short idea, the neckline is the level price has to lose, and the highest of the three tops, 0.64652 here, marks where the shape is broken.
Indicator Settings
MetaTrader 4 opens the tool in its Custom Indicator window, where the Inputs tab holds eleven rows, two of which are headers.
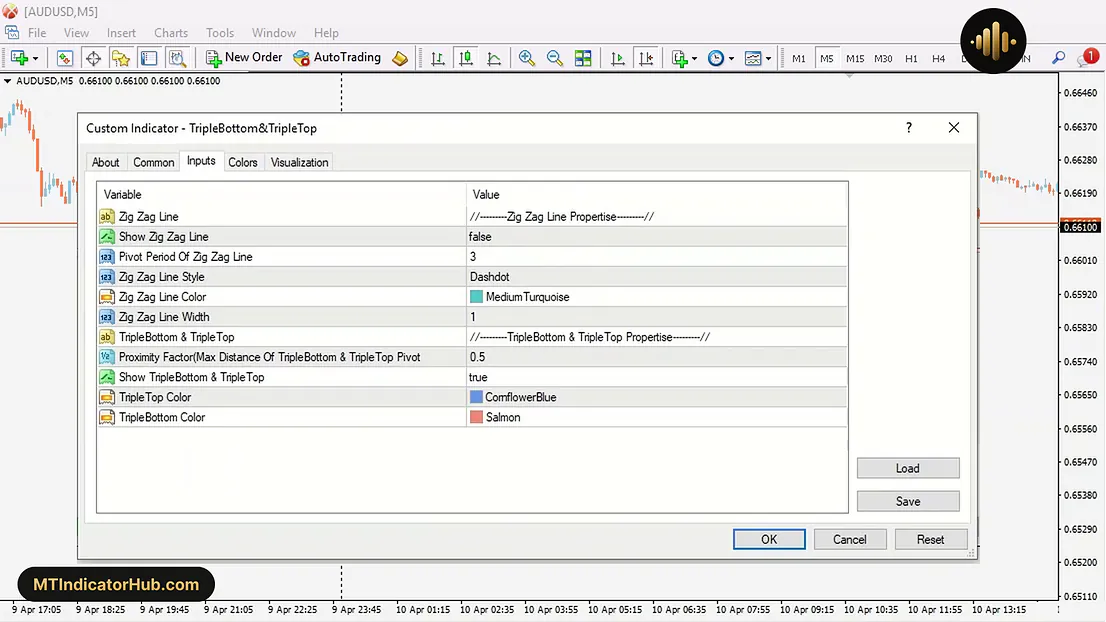
The first header opens the zigzag that supplies the swing points, the second the pattern search and its colours. Only Pivot Period Of Zig Zag Line and Proximity Factor change which patterns appear; every other row changes how they are drawn.
| Input | Default | Effect |
|---|---|---|
| Zig Zag Line: the zigzag that supplies the swing points | ||
| Show Zig Zag Line | false | Shows or hides the dash-dot zigzag |
| Pivot Period Of Zig Zag Line | 3 | Candles used to confirm a swing; larger values keep only bigger swings |
| Zig Zag Line Style | Dashdot | Line style of the zigzag |
| Zig Zag Line Color | MediumTurquoise | Colour of the zigzag |
| Zig Zag Line Width | 1 | Thickness of the zigzag |
| TripleBottom & TripleTop: the pattern search and its drawing | ||
| Proximity Factor (Max Distance Of TripleBottom & TripleTop Pivot) | 0.5 | Largest gap, in ATR units, between the three turns and between the two swings inside them; higher values find more, looser patterns |
| Show TripleBottom & TripleTop | true | Draws or hides the pattern lines, labels and necklines |
| TripleTop Color | CornflowerBlue | Colour of triple top lines and label |
| TripleBottom Color | Salmon | Colour of triple bottom lines and label |
On the M5 chart used here, a pivot period of 3 equals 15 minutes of candles. On H1 the same setting spans three hours, so each swing, and every pattern made from those swings, is built from larger moves.
Conclusion
The tool does one job: it finds three turns at nearly one price, joins them into a labelled triple top or triple bottom and draws the neckline the pattern rests on.
Proximity Factor decides the balance. At 0.5 the matches are tight and rare; at higher values more appear, some only rough copies of the shape, and one sideways stretch can then carry a top and a bottom on top of each other. The indicator draws no arrows, sends no alerts and has no panel, and its drawings leave the chart together with it.
Your rating
Rate this indicator
How useful was this indicator? Click a star.
FAQ
Frequently asked questions
It is the allowed gap between the three turns, and between the two swings that sit between them, counted in multiples of ATR. With 0.5 the shapes stay close to the textbook form and appear rarely; 1.5 lets through more, and some of those match only roughly.
That is the neckline. It passes through the two swings between the three turns and stretches across the pattern, and the solid pattern lines end on the candle that crosses it.
With a large Proximity Factor one sideways stretch can pass both checks: its highs are close enough for a top and its lows close enough for a bottom. At the default of 0.5 that seldom happens.
From the swing highs and lows of its own zigzag, set by Pivot Period Of Zig Zag Line (3 by default). Turning on Show Zig Zag Line draws that zigzag as a turquoise dash-dot line, so the points behind every pattern can be checked on the chart.






Comments
Be the first to comment.