


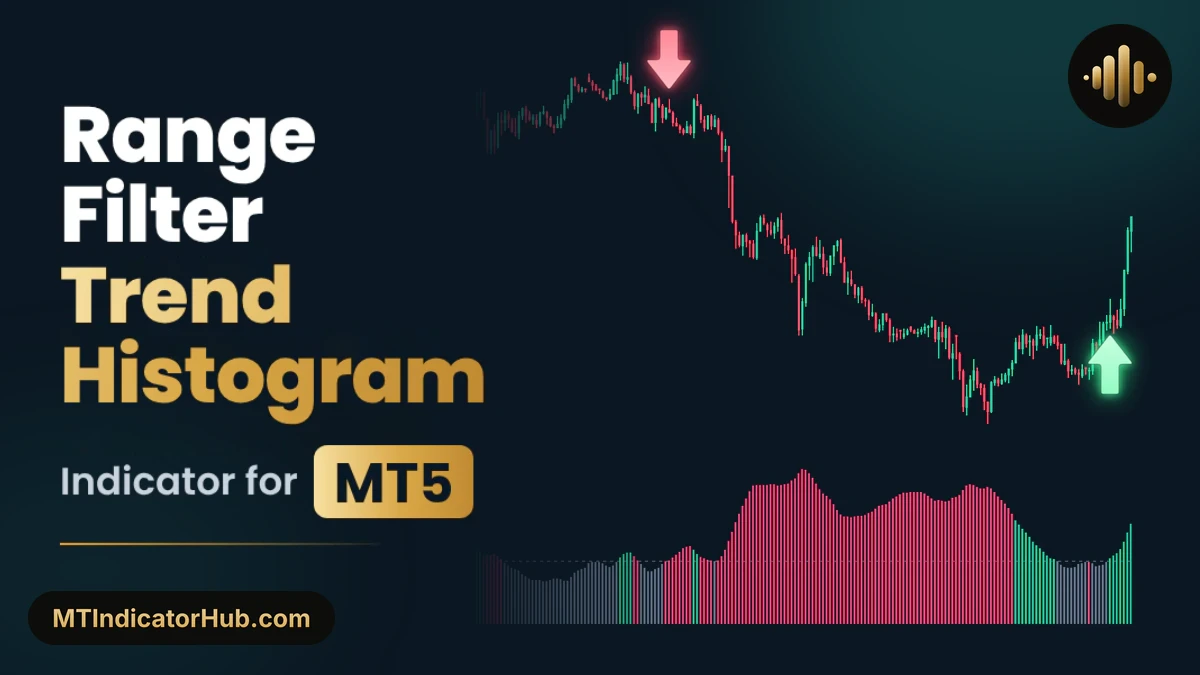
The Range Filter Trend Histogram MT5 indicator measures trend power from ADX and directional movement over 14 candles and draws it as a histogram under the chart: grey bars below the Range / Trend threshold of 20 mark a range, while green or red bars above it mark a strong uptrend or downtrend. When a new trend clears that line, the first closed candle that passes the indicator's filters receives a Buy Arrow underneath, or a Sell Arrow above it.
Shows ADX-based trend power as grey, green and red bars around a 20 line and marks the first filtered candle of each new trend with a Buy or Sell arrow.
Range Filter Trend Histogram Specifications
Range Filter Trend Histogram MT5 sorts the market into range or trend in its own window and draws its arrows on completed candles only.
| Item | Details |
|---|---|
| Platform | MetaTrader 5 (MT5); also available for MT4 |
| Categories | Oscillators, Signal & Forecast |
| Indicator type | Trend, Breakout, Entry Exit |
| Skill level | Intermediate |
| Timeframes | Any; shown here on M15 |
| Trading style | Intraday, Day Trading |
| Markets | Forex, Commodities, Indices, Crypto, Stock (shown on XAUUSD) |
| Display | Trend power histogram with a line and a dashed 20 level in a separate window; Buy and Sell arrows on the chart; info panel with Trend power, Market and Last signal |
| Alerts | None |
| Version | 1.0 |
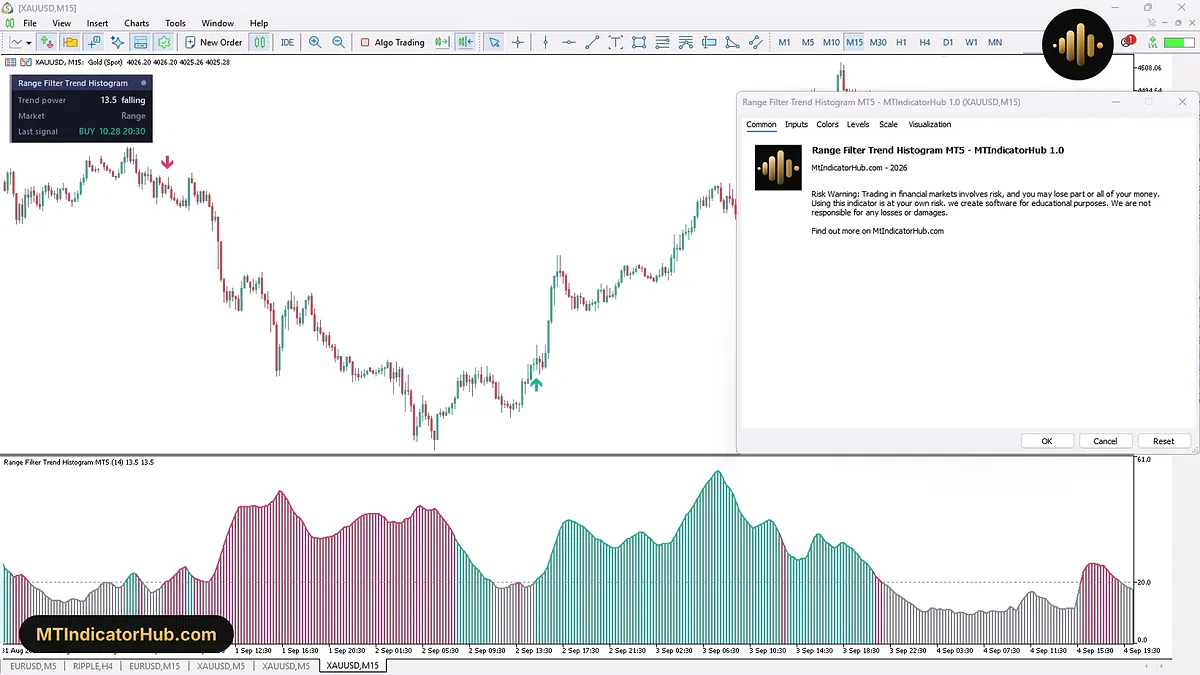
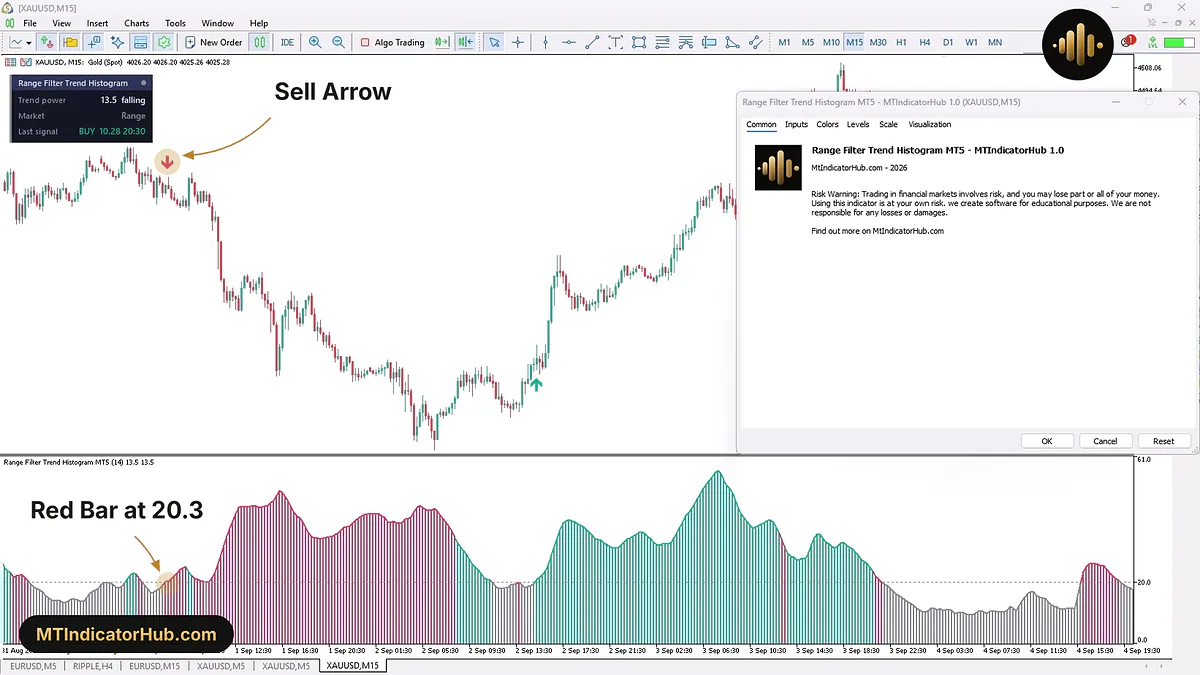
Over this Common tab view, the info panel sits top left with Trend power 13.5 falling and Market Range, and the indicator window underneath alternates grey, green and red bars around its dashed 20 line.
What Is the Range Filter Trend Histogram Indicator?
The Range Filter Trend Histogram indicator is an ADX histogram for MetaTrader 5 that first decides whether the market is trending or ranging, and only then looks for an entry. Its reading, Trend power, is built on the average directional index (ADX) and the two directional movement lines, DI+ and DI-, taken over the Filter period of 14 candles. A taller bar means a stronger trend, whichever way it runs.
The dashed line at 20.0 is the Range / Trend threshold, the border between both states. Every bar shows one of three colours:
- Grey: Trend power under 20, a ranging market;
- Green: Trend power at 20 or above with the upward direction in control, a strong uptrend;
- Red: Trend power at 20 or above with the downward direction in control, a strong downtrend.
A line runs along the tops of the bars. In the Data Window both appear under Indicator window 1 as RFTH Histogram and RFTH Line with the same value, while that window's own label shows Range Filter Trend Histogram MT5 (14) and the current reading.
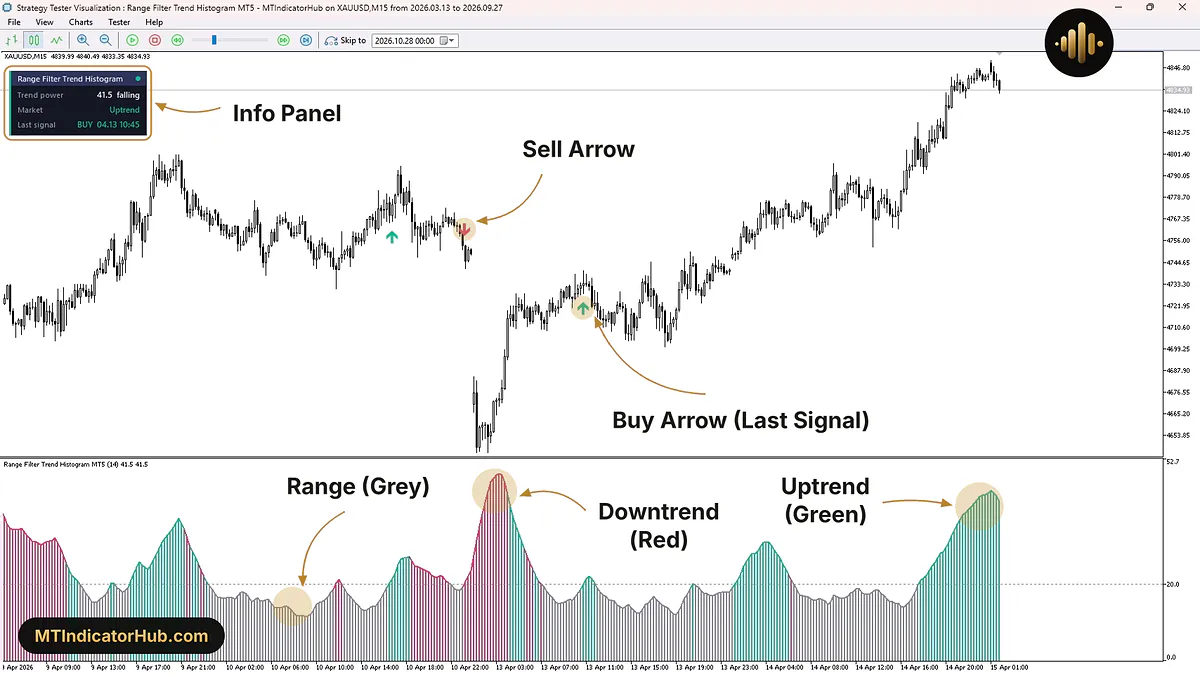
The info panel says the same thing in words. Trend power shows the reading and whether it is rising or falling, Market names the state as Uptrend, Downtrend or Range, and Last signal, the bottom row, holds the latest arrow's side, date and time.
On a Strategy Tester run of XAUUSD M15 between 9 and 15 April 2026, the newest arrow is the Buy of 13 April at 10:45, shown as BUY 04.13 10:45 beside Market Uptrend.
Buy Signal
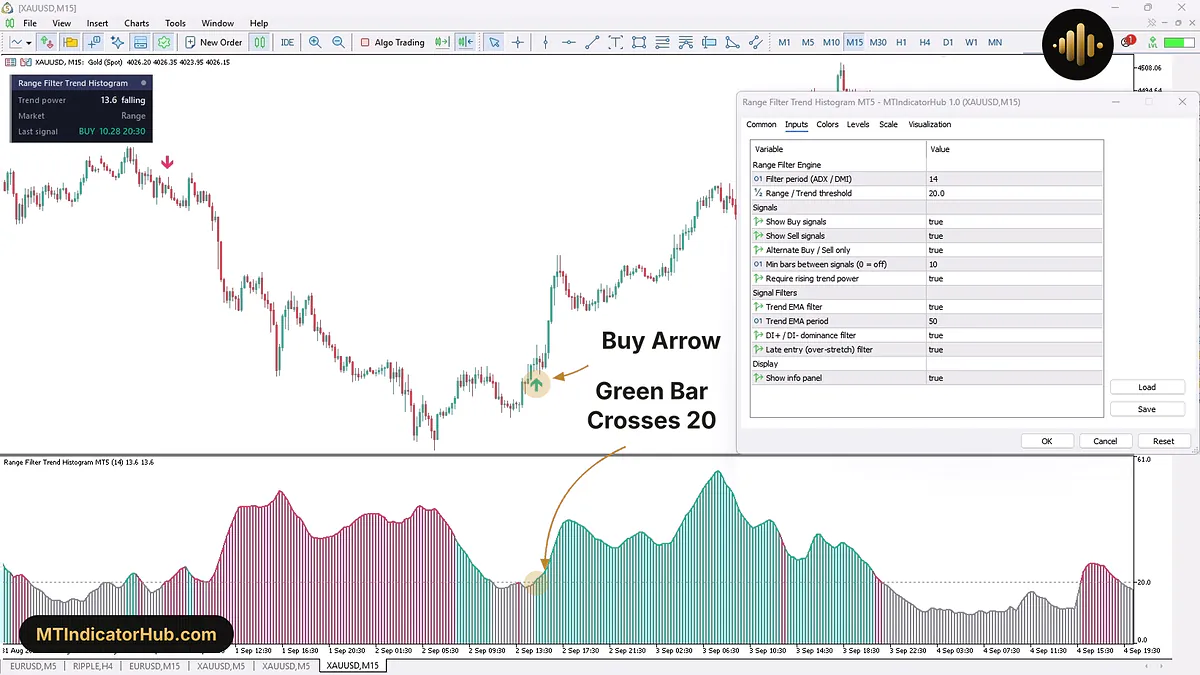
Each Buy Arrow stands at the start of a strong uptrend, not on every green bar. Once Trend power rises through 20 with the upward direction in control, the indicator waits for a candle to close higher than it opened and passes the filters switched on in the Inputs tab, then prints the arrow under it. While that uptrend lasts, no second Buy Arrow follows.
The morning of 2 September 2026 on XAUUSD M15 shows why a green bar alone is not enough. From 08:30 to 11:15 the bars were green, yet Trend power only slid, from about 33.0 down to 21.0 at 11:00, as the power left over from the fall wore off. With Require rising trend power set to true, a falling reading never brings an arrow. By 11:45 the reading was 18.7 and the bars had turned grey.
At 15:15 Trend power climbed back through the line to about 20.9 and that bar printed green. That candle closed above its open, near 4336.75, with a Buy Arrow printed beneath it, 126 candles after the previous arrow, a Sell. The trend then gathered strength: 23.7 at 16:00, 40.3 at 18:00 and 55.4 at 07:30 on 3 September. Half an hour later the 08:00 candle reached 4440.28, about 103.53 over the 15:15 close.
A long position can take its levels from the arrow's own candle: entry after it closes near 4336.75 and a stop below its low near 4330.05, about 6.70 lower. The colour of the bars is the exit cue. Here they stayed green for 84 candles, through the 13:00 bar of 3 September.
Sell Signal
On the sell side the arrow is placed over the candle, and the histogram bar under it is red: Trend power stands at 20 or more with sellers in control, on a candle that ends lower than it opened.
Early on 1 September 2026, XAUUSD M15 sat in a range. Trend power read 18.9 at 04:45 and 17.4 at 05:45, both grey bars. The 06:30 bar had already turned red, but its candle closed above its open, so the indicator kept waiting. The 06:45 candle opened at 4438.48, touched 4443.53 and closed on its low at 4436.59 as Trend power rose to 20.3, which put the Sell Arrow above it.
Red bars carried the rest of the session, apart from a short break in the morning. Trend power reached 49.0 by 16:30, and the 16:00 candle had already dropped to 4326.15, 110.44 lower than the 06:45 close; at 04:45 on 2 September the low went further, to 4288.30. For a short on this arrow, the natural stop sits above the 06:45 high of 4443.53, 6.94 over the close.
The same morning also shows the spacing rule. Two green bars appeared at 08:30 and 08:45, only 7 and 8 candles on from that arrow. Because Min bars between signals is set to 10, arrows stay at least 10 candles apart, so no Buy Arrow could be drawn there.
Indicator Settings
The Inputs tab lists 12 settings under four headers: Range Filter Engine, Signals, Signal Filters and Display.
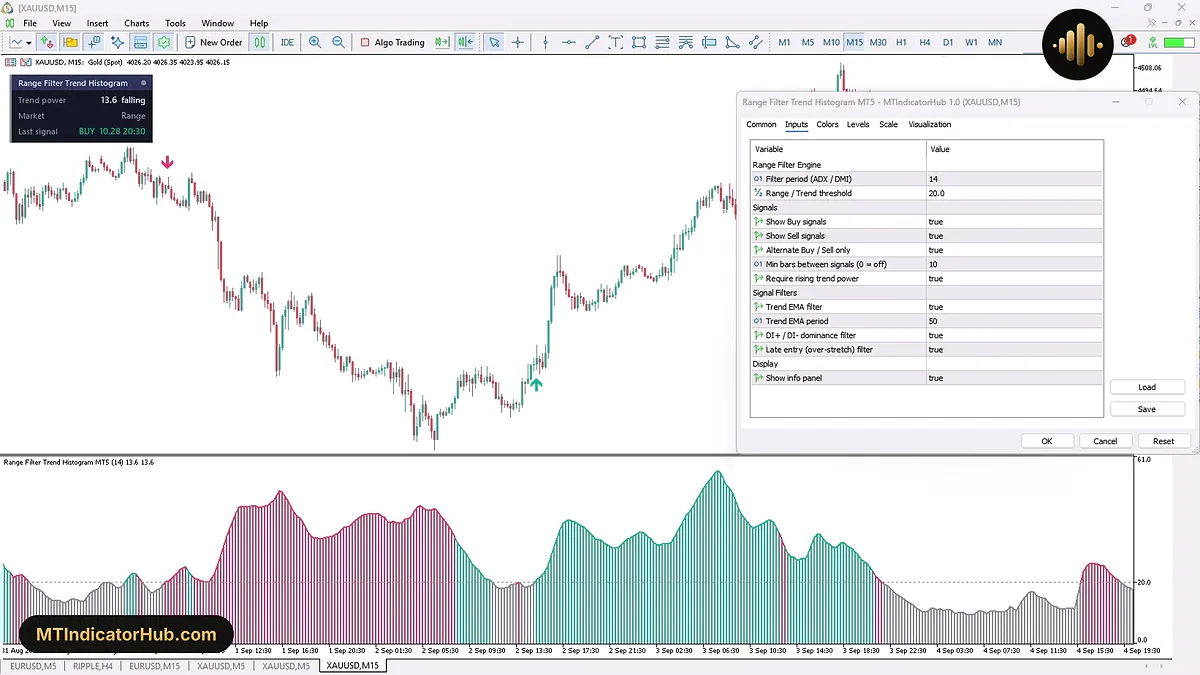
Eight of the inputs are true or false switches, and all eight start at true, so every filter is on from the first load. The three whole numbers, marked 01, are the Filter period, the gap between arrows and the EMA length, while the ½ icon marks the one decimal input, the 20.0 threshold.
| Input | Default | What it changes |
|---|---|---|
| Range Filter Engine: how Trend power is measured and split into range and trend | ||
| Filter period (ADX / DMI) | 14 | Candles behind the ADX and DI+ / DI- readings that make up Trend power |
| Range / Trend threshold | 20.0 | Line between grey range bars and green or red trend bars; a higher value counts only stronger trends |
| Signals: which arrows print and how often | ||
| Show Buy signals | true | Buy Arrows drawn when true, none when false |
| Show Sell signals | true | Sell Arrows drawn when true, none when false |
| Alternate Buy / Sell only | true | Makes the two sides take turns, so one side never prints twice in a row |
| Min bars between signals (0 = off) | 10 | Lowest candle count allowed between arrows; 0 switches the gap off |
| Require rising trend power | true | Allows an arrow only while Trend power is going up |
| Signal Filters: extra checks before an arrow appears | ||
| Trend EMA filter | true | Buys only with price above a rising EMA, sells only with price below a falling one |
| Trend EMA period | 50 | Length of that EMA |
| DI+ / DI- dominance filter | true | Asks for a clear side, with buyers or sellers in control, instead of a mixed market |
| Late entry (over-stretch) filter | true | Holds back an arrow once price has stretched a long way from the EMA |
| Display: the panel over the candles | ||
| Show info panel | true | Switches the info panel and its three rows on or off |
Three of these inputs are counted in candles, which ties their duration to the timeframe. On M15, the Filter period of 14 covers 3 hours 30 minutes, the 10-candle gap lasts 2 hours 30 minutes, while the 50-period Trend EMA spans 12 hours 30 minutes; on H1 they stretch to 14, 10 and 50 hours.
Conclusion
Range Filter Trend Histogram MT5 has a single task: it separates range from trend with one ADX-based reading and a 20 line, then marks only the first qualifying candle of each new trend with an arrow.
Since Trend power is built from 14 candles of directional movement, it confirms a trend once the move is already under way, and an arrow waits until its own candle is complete. A green or red bar alone does not promise an arrow, because the switches in the Signals and Signal Filters groups can hold it back, and a second trend in the same direction stays unmarked while Alternate Buy / Sell only is switched on. Its panel reports on the live, right-hand end of the chart, so once you scroll to older candles, the Market and Last signal rows no longer match what is on screen. The Inputs tab offers no alert setting either; a new arrow shows up on the chart and nowhere else.
Your rating
Rate this indicator
How useful was this indicator? Click a star.
FAQ
Frequently asked questions
It is the Range / Trend threshold. Below it the bars stay grey and Market on the panel says Range; at or above it they take green or red, and Market reads Uptrend or Downtrend depending on which side leads. Setting the input higher than 20.0 makes the indicator call a trend only when Trend power is stronger, so fewer bars carry colour.
Green only says that a strong uptrend is in place. An arrow also requires a rising reading, a candle that closes upward, the filters in the Inputs tab to agree, enough candles after the last arrow and, with the alternation input at true, a Sell as that last arrow. On 2 September 2026 the bars stayed green from 08:30 to 11:15 while Trend power eased from about 33.0 to 21.0; the Buy Arrow came only at 15:15, after the reading had dipped below 20 and climbed back through it.
It tells you which way Trend power is moving at the newest candle: "rising" when the reading is going up, "falling" when it is going down. It matters for signals, because with Require rising trend power at true the indicator prints arrows only while that reading climbs.
The Late entry (over-stretch) filter, true by default, looks at how far price has already travelled from the Trend EMA, 50 periods by default. When price is stretched too far from that average, the indicator skips the arrow instead of signalling a late entry; with the filter off, arrows can also appear after an extended run.






Comments
Be the first to comment.