


The ATR Volume Pressure MT5 indicator blends the size of each candle with its volume into one pressure reading from 0 to 100, drawn as a coloured histogram under the chart. When that reading breaks above the High (expansion) level of 60, a Buy Arrow or a Sell Arrow appears on the candles, and the side is set by whether price stands higher or lower than it did 10 candles earlier.
Joins candle range and volume into a 0 to 100 pressure reading and prints a Buy or Sell arrow on the candle that first breaks it above 60.
ATR Volume Pressure Specifications
ATR Volume Pressure Signals MT5 keeps its histogram in a separate window and settles every arrow on a closed candle only.
| Item | Details |
|---|---|
| Platform | MetaTrader 5 (MT5); also available for MT4 |
| Categories | Oscillators, Volume, Signal & Forecast |
| Indicator type | Volatility, Volume, Breakout |
| Skill level | Intermediate |
| Timeframes | Any; shown here on M15 |
| Trading style | Intraday, Day Trading |
| Markets | Metals, Forex (shown on XAUUSD) |
| Display | Pressure histogram from 0 to 100 with 60, 50 and 40 levels in a separate window; Buy and Sell arrows on the chart; status panel with Value, Market and Last signal |
| Alerts | None |
| Version | 1.0 |
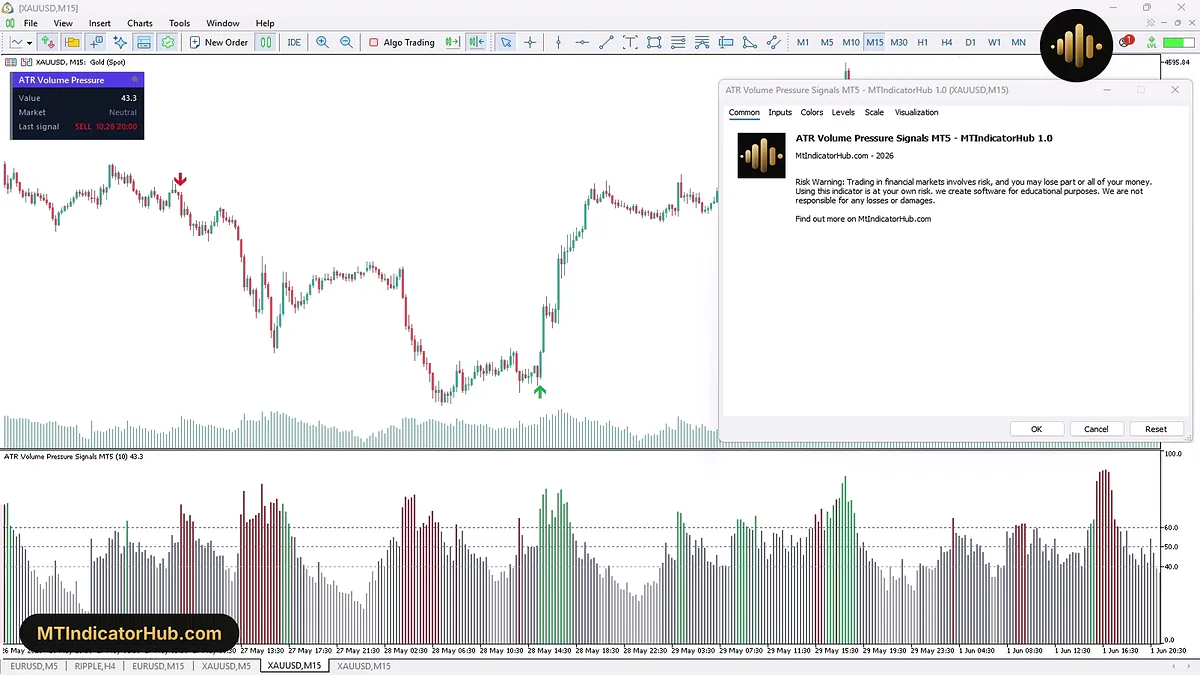
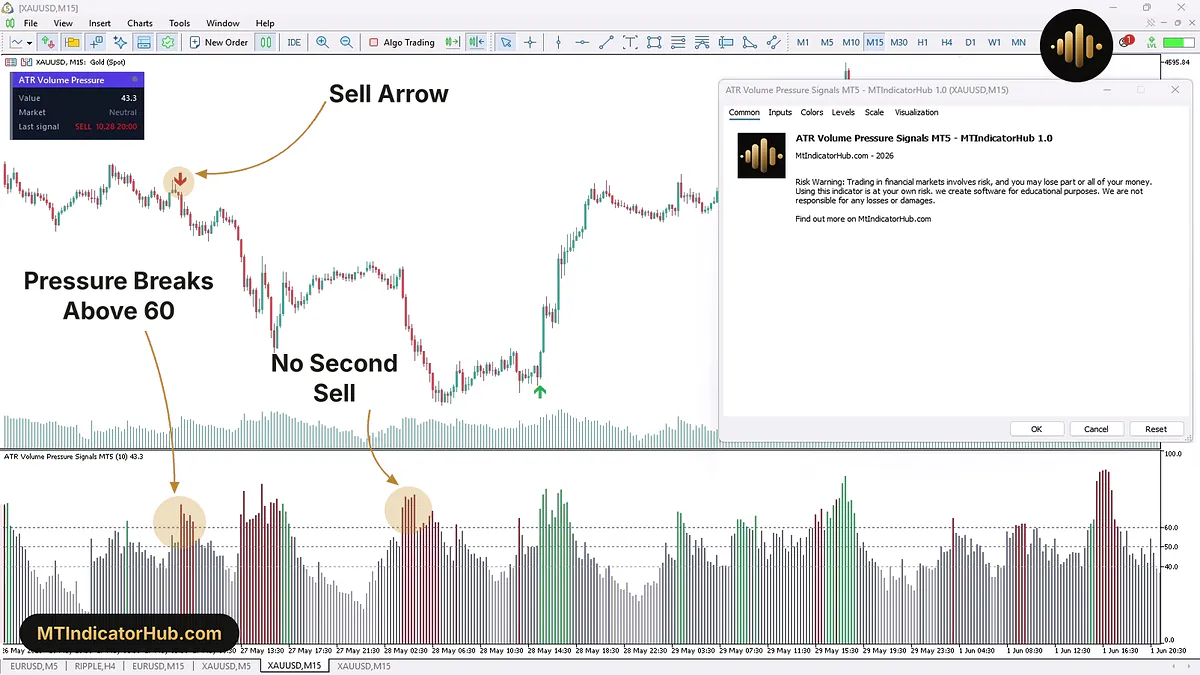
Behind the Common tab, the status panel at the top left of the XAUUSD M15 chart reads Value 43.3 and Market Neutral, and the pressure histogram runs in green, red and grey bars under the candles.
What Is the ATR Volume Pressure Indicator?
The ATR Volume Pressure indicator is a volume pressure oscillator for MetaTrader 5. For every candle it joins two things: how far price travelled, measured with the average true range (ATR), and how much volume traded. It then rates over the last 10 candles, the default Pressure period, whether that combined pressure has been building or fading. The answer is a number from 0 to 100; the higher it sits, the faster market activity is growing.
Three dashed levels split the window. The High (expansion) level is 60, the Low (quiet) level is 40, and a middle line marks 50. Each bar takes one of four colours:
- Green: pressure at 60 or above while price is higher than 10 candles before;
- Red: pressure at 60 or above while price is lower than 10 candles before;
- Dark grey: pressure between the two levels, a neutral market;
- Light grey: pressure under 40, a quiet market.
The status panel repeats this in words. Value is the current reading, Market is Bullish Expansion, Bearish Expansion, Neutral or Quiet, and Last signal gives the side, date and time of the latest arrow, such as BUY 03.16 14:15. In the Data Window the reading appears as AVPO Pressure under Indicator window 1, and the window label reads ATR Volume Pressure Signals MT5 (10) followed by the value.
The volume part comes from tick volume by default, and the Volume type input can switch it to Real volume.
Buy Signal
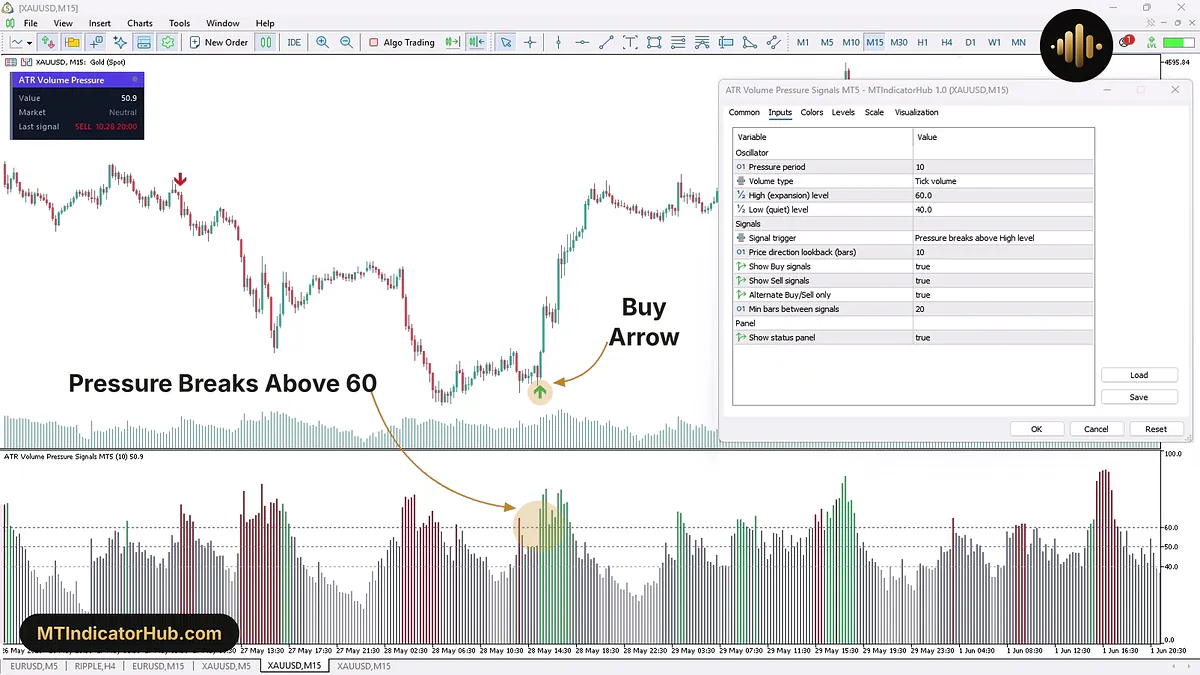
A Buy Arrow needs two things on the same candle: the pressure has to break from below 60 to above it, and price has to be higher than 10 candles back, which is exactly when the bar turns green. The arrow is printed under that candle.
On XAUUSD M15 on 28 May 2026, the histogram read 49.8 at 15:00 and about 50.5 at 15:15, both dark grey. At 15:30 it jumped to about 69.5 and the bar came out green, so the Buy Arrow appeared beneath the 15:30 candle. It was the first green break above 60 since the last arrow, a Sell 120 candles earlier, so neither Alternate Buy/Sell only nor the 20-candle gap of Min bars between signals stood in the way.
The pressure kept climbing on the next bars: 77.0 at 15:45, when the candle ran from 4402.25 to 4432.10, and 79.7 at 16:00. The green run lasted 11 bars, to 18:00, and the 17:45 candle reached 4480.25.
Read as a long setup, the arrow candle gives the levels. A trader could enter at the next open, 4402.25, and put a stop under the 15:30 low near 4383.45, about 18.80 lower. Green bars mean expansion is still under way; once they drop back to dark grey under 60, the push that produced the arrow has cooled.
Sell Signal
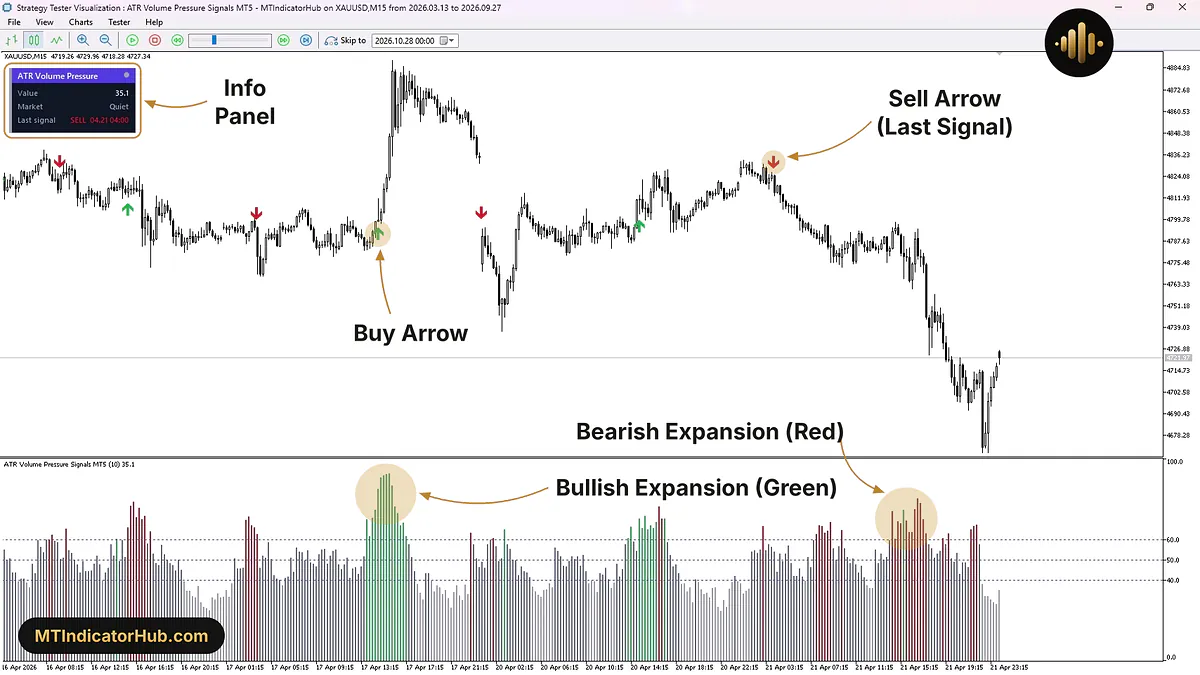
A Sell Arrow sits above the candle, and on the histogram the bar that triggers it is red: pressure has broken above 60 while price is lower than 10 candles before.
The example is the morning of 27 May 2026 on XAUUSD M15. At 08:15 the reading was about 52.4; at 08:30 it reached 71.8. That 08:30 candle opened at 4507.16, touched 4508.65 and closed at 4493.66, 15.54 below the 4509.20 close of the 06:00 candle ten bars earlier. The bar turned red and the Sell Arrow was drawn over the candle.
The bars stayed red through 09:30, five in all. By 14:45 the low stood at 4424.96, 68.70 under the 08:30 close. For a short, the high of the arrow candle is the natural place for a stop: 4508.65, 14.99 above the close.
The same chart also shows the alternation filter at work. At 04:00 on 28 May, 74 candles after that Sell Arrow, a red bar broke above 60 again with a reading of 70.2, yet no second Sell Arrow appeared. With Alternate Buy/Sell only set to true, the arrow after a sell must be a buy, so that bearish expansion stayed unmarked on the candles; only the red bars and the panel's Bearish Expansion recorded it.
Indicator Settings
The Inputs tab holds 11 settings in three groups: Oscillator, Signals and Panel.
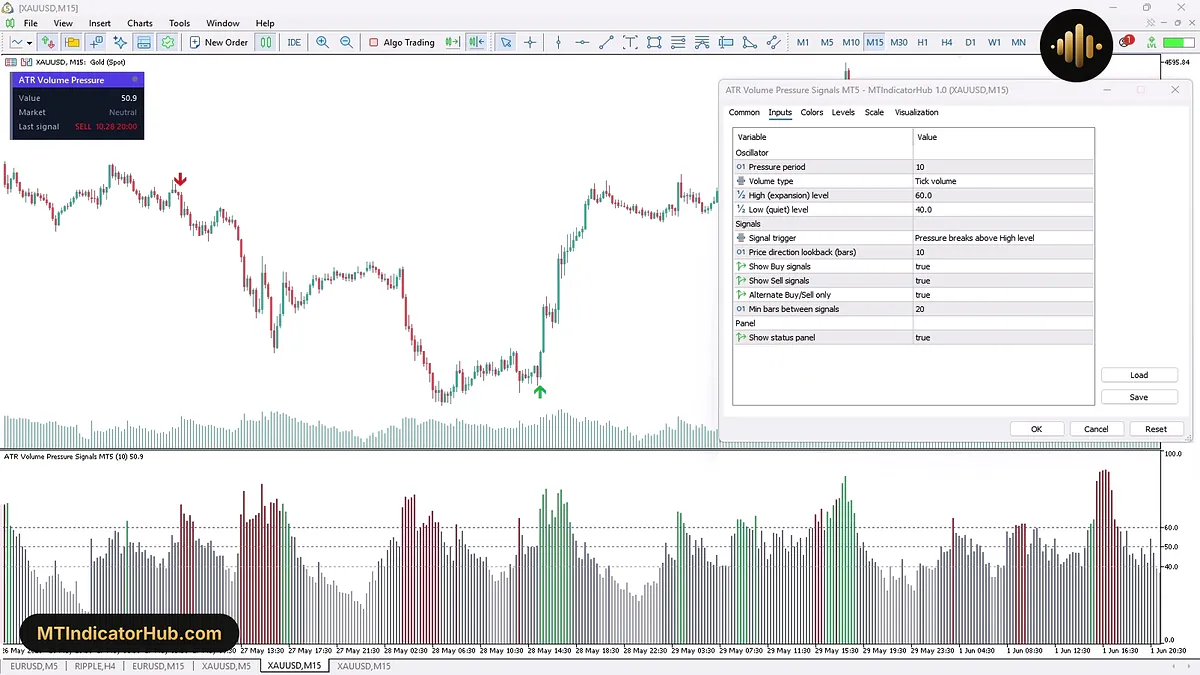
The icon before each name shows its type: 01 for whole numbers such as Pressure period, ½ for the two decimal levels, and a list icon for Volume type and Signal trigger. Signal trigger's list holds three choices, Pressure breaks above High level, Pressure crosses above 50 and Pressure recovers above Low level.
| Input | Default | What it changes |
|---|---|---|
| Oscillator: how the pressure reading is built and graded | ||
| Pressure period | 10 | Candles used for the range and for the pressure average |
| Volume type | Tick volume | Tick volume or Real volume as the volume source |
| High (expansion) level | 60.0 | Line above which bars turn green or red and the panel shows an expansion |
| Low (quiet) level | 40.0 | Line under which bars turn light grey and the panel shows Quiet |
| Signals: when an arrow is drawn | ||
| Signal trigger | Pressure breaks above High level | Which crossing fires an arrow: above the High level, above 50, or back above the Low level |
| Price direction lookback (bars) | 10 | How many candles back price is compared to choose Buy or Sell |
| Show Buy signals | true | Draws or hides the Buy Arrows |
| Show Sell signals | true | Draws or hides the Sell Arrows |
| Alternate Buy/Sell only | true | Makes arrows take turns, so two arrows of one side never follow each other |
| Min bars between signals | 20 | Smallest number of candles between two arrows |
| Panel: the status box on the chart | ||
| Show status panel | true | Shows or hides the box with Value, Market and Last signal |
All the counting inputs are in candles, so their span in time follows the chart. On M15, Pressure period 10 and Price direction lookback 10 each cover 2 hours 30 minutes, and Min bars between signals 20 keeps arrows at least 5 hours apart; on H1 the same values stretch to 10 hours and 20 hours.
Conclusion
The ATR Volume Pressure MT5 indicator watches one thing: whether range and volume together are speeding up. It marks the candle that first lifts that pressure above 60 with an arrow, pointing the way price has moved over the last 10 candles.
The arrow appears only after its candle has closed, so the first part of the move is already on the chart. Direction comes only from where price stands against 10 candles earlier, as the Inputs tab holds no trend filter, and with Alternate Buy/Sell only on, a second expansion on the same side gets no arrow. The Inputs tab has no alert option, so new arrows are spotted by watching the chart. Real volume works only on symbols whose broker sends exchange volume; where the Data Window's Volume row stays at 0, the Tick volume default is the source that carries data.
Your rating
Rate this indicator
How useful was this indicator? Click a star.
FAQ
Frequently asked questions
It means the combined pressure of range and volume is expanding. The bar then turns green when price is higher than 10 candles earlier, or red when it is lower, and the panel's Market row reads Bullish Expansion or Bearish Expansion. Under 40 the same row reads Quiet, and between 40 and 60 it reads Neutral.
Red bars only say that pressure is above 60 with price falling. An arrow also needs a fresh break through 60, at least 20 candles since the last arrow, and, while Alternate Buy/Sell only is true, a previous arrow on the other side. On 28 May 2026 at 04:00 the bars were red with a reading of 70.2, but the arrow before them was already a Sell.
They move the crossing that fires an arrow. Pressure breaks above High level, the default, waits for 60; Pressure crosses above 50 reacts at the middle line; Pressure recovers above Low level fires when the reading climbs back over 40 after a quiet spell. The direction is still taken from Price direction lookback.
Use the one your symbol fills in. On the XAUUSD M15 chart of our examples, the Data Window gives every candle a Tick Volume figure, 1633 for the 22:00 candle of 27 May 2026, but a Volume of 0, so Tick volume, the default, is the source with data there. Real volume is the other choice in the Volume type list.






Comments
Be the first to comment.