


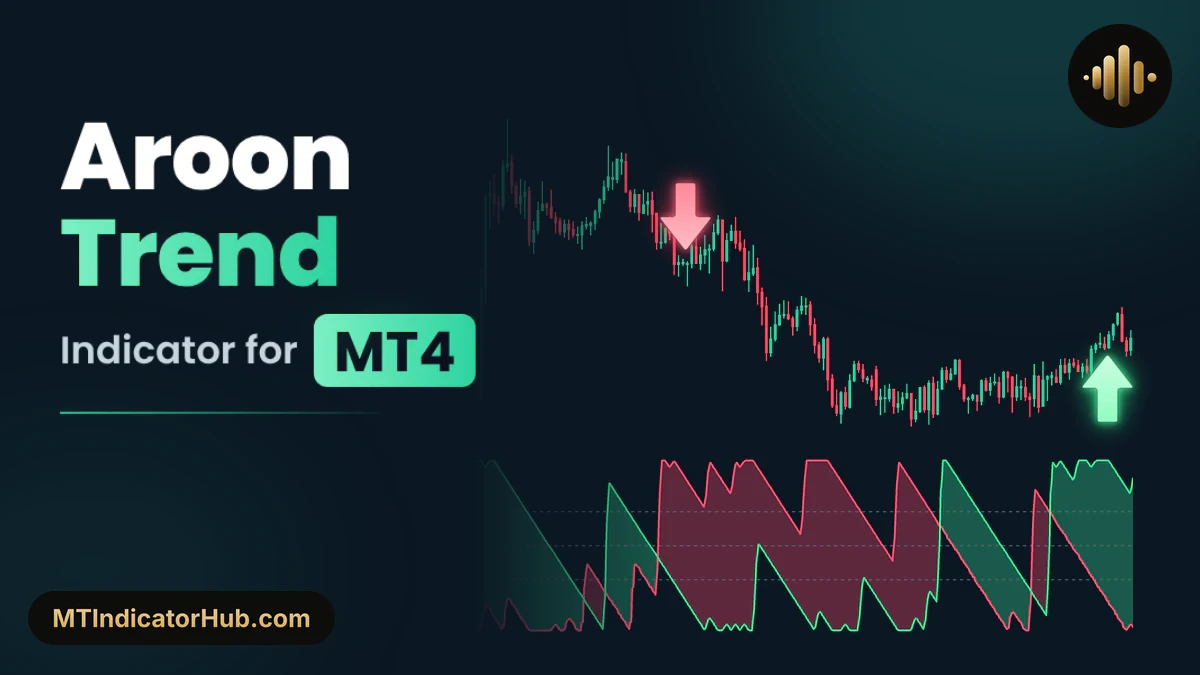
The Aroon Trend MT4 indicator judges a trend by time rather than by distance. It counts the candles since the highest high and the lowest low of the last 25, turns both counts into an Aroon Up line and an Aroon Down line on a 0 to 100 scale, and marks a strong move with an arrow: a Buy Arrow below the closed candle when Aroon Up stands at 70 or more and Aroon Down at no more than 30, a Sell Arrow above it in the opposite case. Between the arrows, a coloured cloud and a three-row panel keep the current state in sight.
Counts the candles since the last 25-candle high and low, draws them as two Aroon lines and marks strong trends with Buy and Sell arrows on MT4.
Aroon Trend Specifications
The table sums up what Aroon Trend Signals MT4 draws and where; every arrow waits for its candle to close.
| Item | Details |
|---|---|
| Platform | MetaTrader 4 (MT4); also available for MT5 |
| Categories | Oscillators, Signal & Forecast |
| Indicator type | Trend, Breakout, Entry Exit |
| Skill level | Intermediate |
| Timeframes | Any, Multi Timeframe; the examples use M5 and M15 |
| Trading style | Scalper, Intraday, Day Trading |
| Markets | Forex, Commodities, Indices, Crypto, Stock (examples on XAUUSD) |
| Display | Separate window with Aroon Up (green) and Aroon Down (crimson) between 0 and 100, a cloud between them and dotted levels at 70, 50 and 30; arrows for Buy and Sell above or below the candles; info panel in the upper left corner |
| Alerts | None |
| Version | 1.0 |
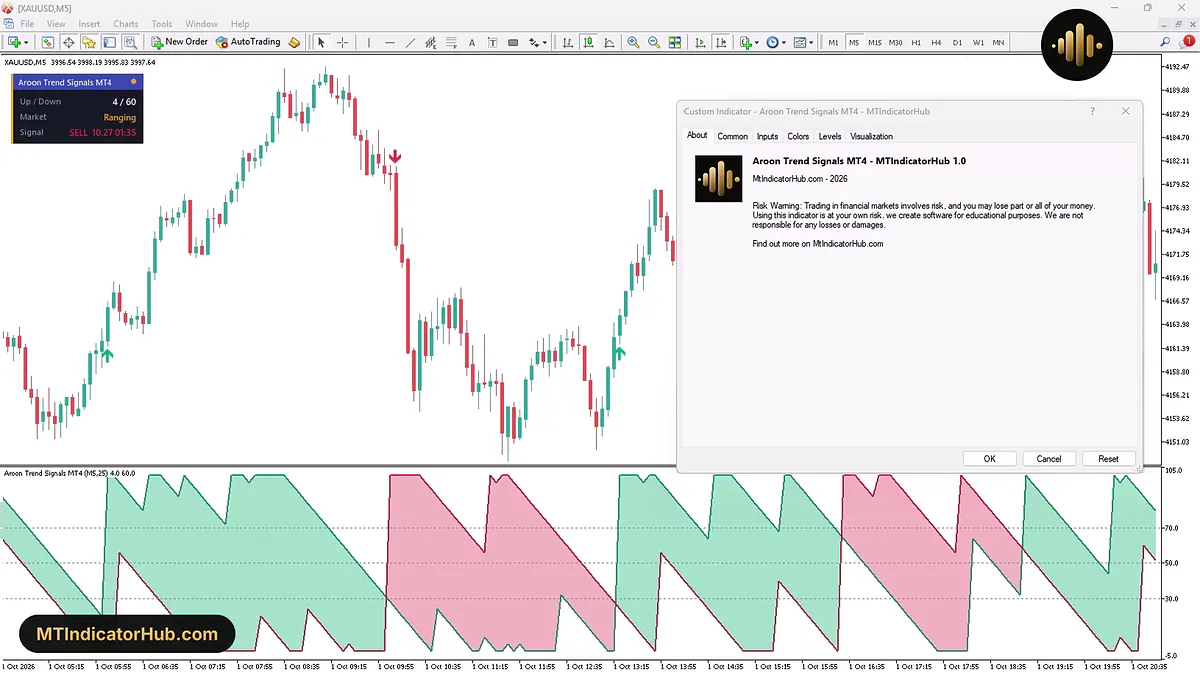
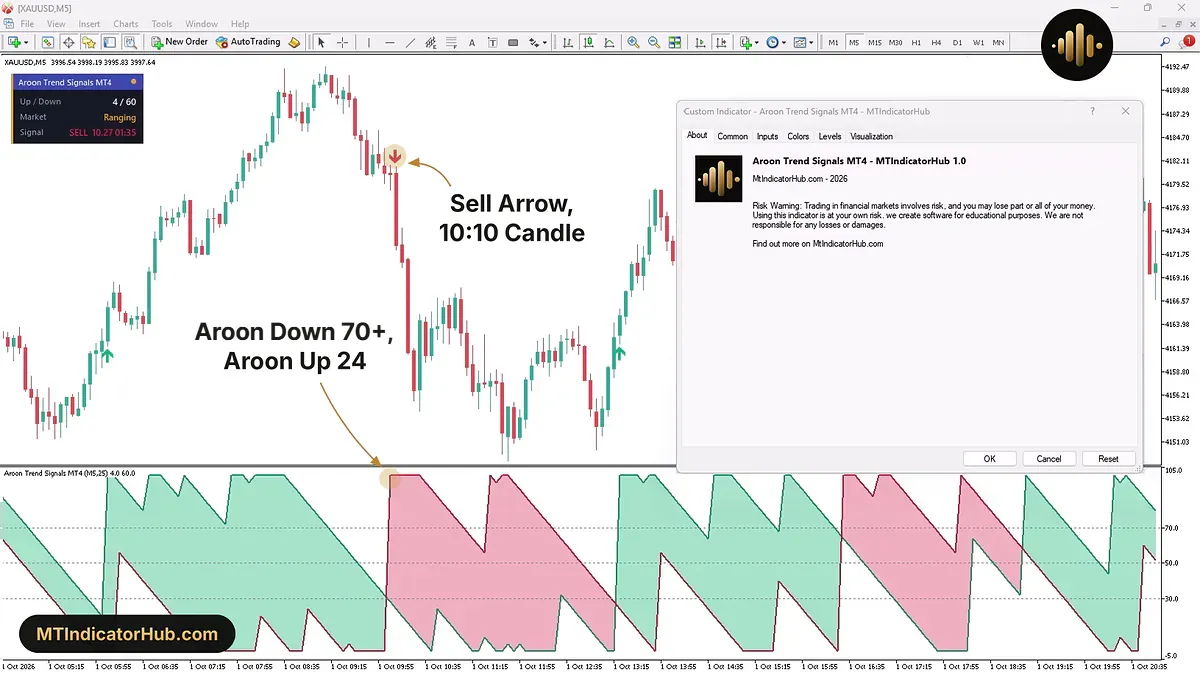
On MT4 the properties window opens as Custom Indicator, and its About tab carries the name Aroon Trend Signals MT4 - MTIndicatorHub with version 1.0. Behind it, the panel title repeats Aroon Trend Signals MT4, and its Market row reads Ranging in orange next to Up / Down 4 / 60.
What Is the Aroon Trend Indicator?
Aroon Trend is a MetaTrader 4 trend tool that asks one question on every candle: which extreme is newer, the highest high or the lowest low of the Aroon period? Aroon Up answers for the high and Aroon Down for the low. A reading of 100 means the extreme was set on this very candle; each candle that passes without a new one takes the line lower, and after 25 candles it touches 0. With the default period of 25, every step is 4 points, which is why the readings come as 100, 96, 92 and so on down to 0.
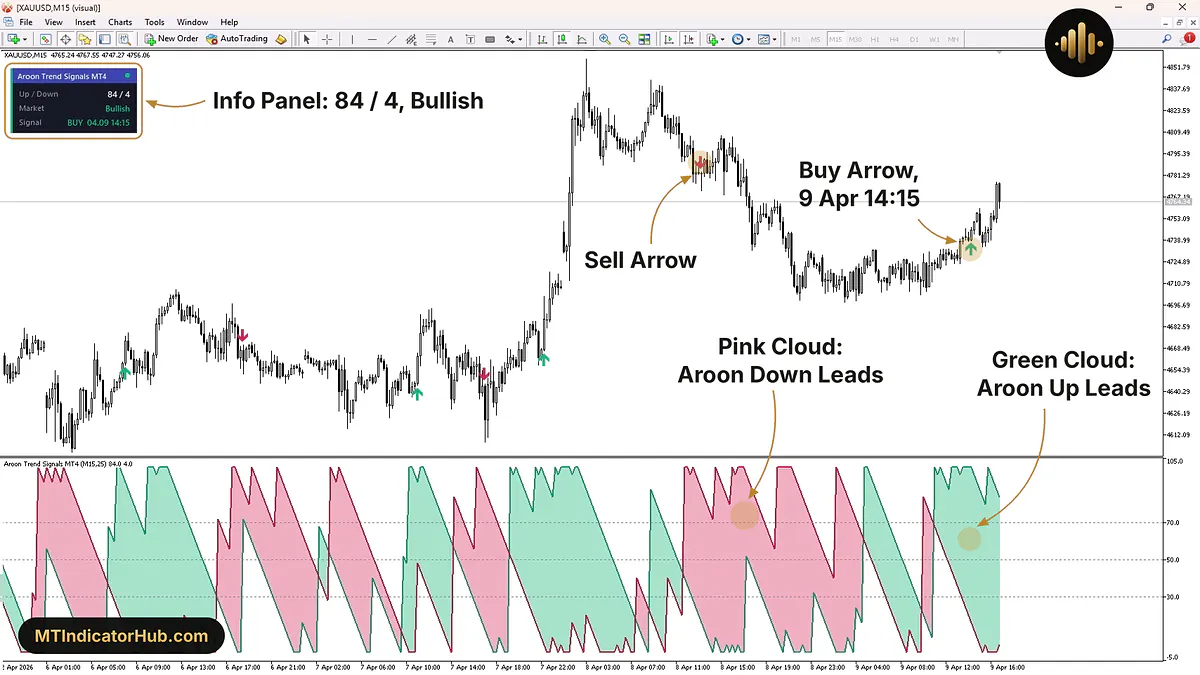
In the lower window, green marks Aroon Up and crimson marks Aroon Down. The area between them turns into a green cloud while Aroon Up sits above Aroon Down and a pink cloud when Aroon Down takes over. Dotted lines cross the window at three heights: 70, which is the Strong-trend level, the midpoint 50, and 30, the ceiling for the weaker line. The window label, such as Aroon Trend Signals MT4 (M15,25) 84.0 4.0, shows the calculation timeframe, the period and the two latest values. Pointing at an arrow with the mouse shows that candle's two Aroon readings.
The info panel turns the same readings into words. Up / Down lists both values for the newest candle, and Signal gives the type, date and time of the last arrow. The Market row describes the market trend: Bullish if Aroon Up is ahead and at 70 or more, Bearish when the same holds for Aroon Down, and Ranging otherwise; the strip on the left of the panel and the dot in its title change to green, red or orange to match.
A test in the Strategy Tester on XAUUSD M15 shows the full cycle: between 6 and 9 April 2026 seven arrows alternate, and the paused panel reads 84 / 4, Market Bullish and BUY 04.09 14:15, the newest arrow on the chart.
Buy Signal
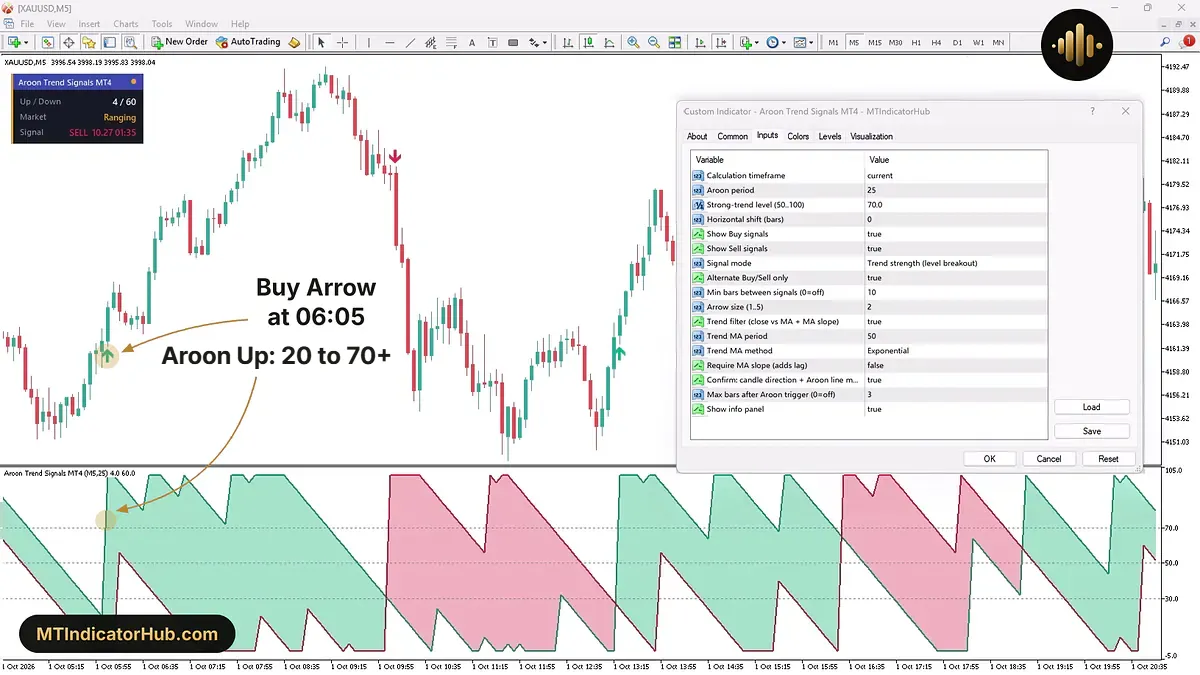
A buy in the default Trend strength (level breakout) mode needs Aroon Up at 70 or higher, the Strong-trend level, and Aroon Down no higher than 30 on a closed candle. Two checks follow. The trend filter's exponential moving average of 50 periods has to lie below the close, and the candle has to close above the previous close while Aroon Up is not dropping.
On 1 October 2026 the XAUUSD M5 chart shows how quickly this can happen. At 06:00 Aroon Up was only 20 and Aroon Down 0. The next candle broke to a new high for the last 25 candles, so Aroon Up went straight to 100 with Aroon Down still at 0, and the Buy Arrow appeared under the 06:05 candle. Its open was 4162.14, its high 4166.48, its low 4161.56 and its close 4165.90, a gain of 3.76 from open to close.
What followed is just as telling. Between 06:50 and 09:10, 29 candles in a row kept Aroon Up between 72 and 100 with Aroon Down no higher than 28, and the indicator stayed silent. Alternate Buy/Sell only, true by default, lets a Buy be followed only by a Sell, so the rally kept a single Buy Arrow. The 09:10 candle peaked at 4192.46, 30.90 above the low of the arrow candle, the level under which a long trade from this arrow would keep its stop.
Sell Signal
A sell mirrors the buy: Aroon Down must be at 70 or more, Aroon Up at 30 or less, the close below the 50-period average, and the candle must close lower than the one before while Aroon Down holds or rises. The Sell Arrow sits above the high of that candle.
On the same chart, the change of direction came after 10:00, when the readings were 32 for Aroon Up and 0 for Aroon Down. At 10:05 price set the lowest low of the 25-candle window: Aroon Down leapt to 100, Aroon Up slipped to about 28, and the pink cloud took over. The arrow, however, appeared on the 10:10 candle, which the Data Window lists with Aroon Down at 100 and Aroon Up at 24.
That one-candle delay is normal for this tool. The Aroon condition starts a short window, and Max bars after Aroon trigger, 3 by default, decides how many candles an arrow may still come after it; past that, the setup counts as too old to mark. The 10:10 candle itself opened at 4180.69 and closed at 4172.69, 8.00 lower, with a high of 4181.41 for a short trader's stop.
By 13:00 gold had dropped to 4150.11, 31.30 under the high of the arrow candle. Twenty minutes later, at 13:20, a Buy Arrow closed the sequence as Aroon Up returned to 100, 38 candles behind the Sell.
Indicator Settings
MetaTrader 4 has no input groups, so the 17 settings of Aroon Trend Signals MT4 sit in a single list in the Inputs tab.
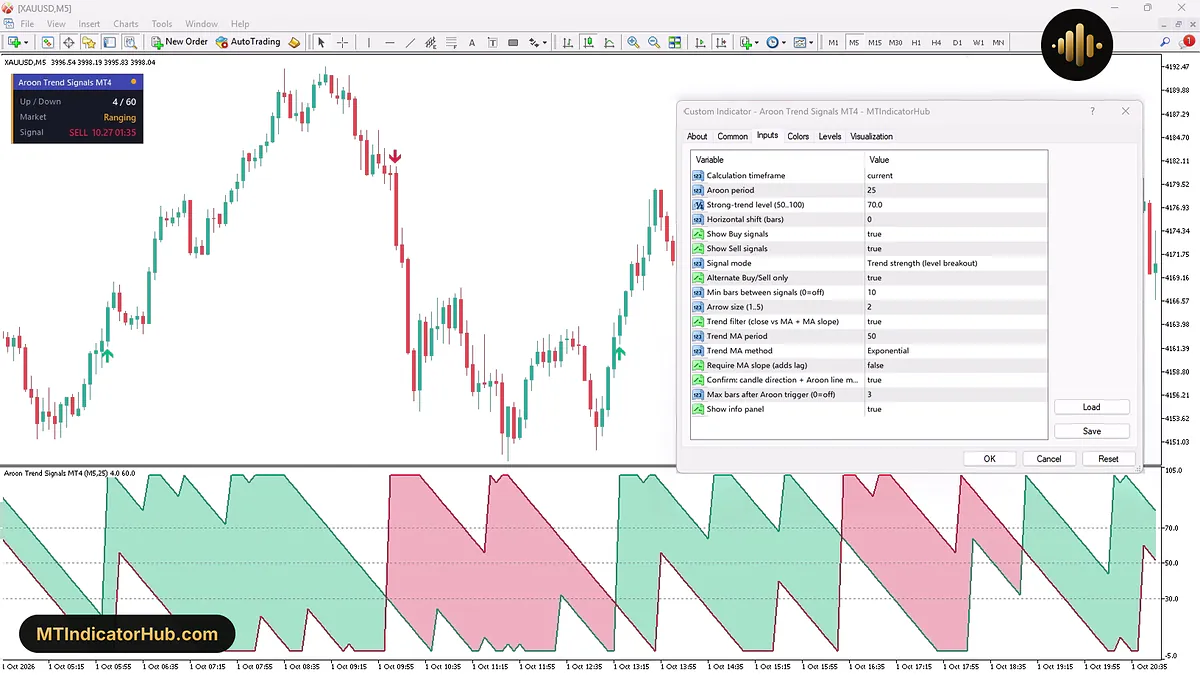
The list runs from the Aroon calculation through the arrows and the moving average filter to the timing limits and the panel switch. The name of the candle and Aroon line confirmation input is longer than the list column, so it appears cut short, here as well as in the table.
| Input | Default | What it changes |
|---|---|---|
| Calculation timeframe | current | Timeframe the Aroon lines and arrows are worked out on; it can be the chart's own or a higher one |
| Aroon period | 25 | Number of candles searched for the highest high and the lowest low |
| Strong-trend level (50..100) | 70.0 | Reading the stronger line must reach before an arrow prints or the panel turns Bullish or Bearish; the weaker line must stay at or below 100 minus this value |
| Horizontal shift (bars) | 0 | Shifts the drawing of the two lines left or right |
| Show Buy signals | true | Shows or hides the Buy Arrows |
| Show Sell signals | true | Shows or hides the Sell Arrows |
| Signal mode | Trend strength (level breakout) | Picks between the level rule and Aroon Up/Down crossover, where an arrow comes when the two lines swap places |
| Alternate Buy/Sell only | true | Allows only a Sell after a Buy and only a Buy after a Sell |
| Min bars between signals (0=off) | 10 | Smallest number of candles from one arrow to the next |
| Arrow size (1..5) | 2 | How large the arrows are drawn |
| Trend filter (close vs MA + MA slope) | true | Keeps Buy Arrows to closes above the moving average and Sell Arrows to closes under it |
| Trend MA period | 50 | Length of the filter's moving average in candles |
| Trend MA method | Exponential | Kind of moving average the filter uses |
| Require MA slope (adds lag) | false | Set to true, it also wants the average sloping with the trade, which delays arrows |
| Confirm: candle direction + Aroon line m… | true | Buy only on a higher close with Aroon Up not dropping, Sell only on a lower close with Aroon Down not dropping |
| Max bars after Aroon trigger (0=off) | 3 | Latest candle, counted from the start of the Aroon condition, that may still get an arrow; 0 means no limit |
| Show info panel | true | Shows or hides the three-row info panel |
All counts use calculation-timeframe candles. On M15, the 25-candle Aroon period covers 6 hours 15 minutes, the 10-candle minimum gap 2 hours 30 minutes and the 3-candle trigger limit 45 minutes, while the 50-period average reaches back 12 hours 30 minutes.
Conclusion
Aroon Trend for MetaTrader 4 reads trend strength from the age of the last high and low: the newer one sets the leading line, and an arrow comes only when that line passes 70 and the other is held at 30 or below. The cloud colour and the Market row describe the state between arrows, so the chart shows whether the side of the last arrow still leads.
Because Aroon measures time, not size, a high that beats the old one by a fraction is treated like a strong breakout. The filters can hold an arrow back for a candle or two, and Max bars after Aroon trigger drops it once it is too late. With Alternate Buy/Sell only switched on, a second push the same way as the last arrow carries no new mark, and in a flat market where both lines stay under 70 the panel keeps reading Ranging. The tool has no alert setting, and its calculation timeframe can never be lower than the chart's.
Your rating
Rate this indicator
How useful was this indicator? Click a star.
FAQ
Frequently asked questions
The Aroon period is 25, and each line covers 0 to 100 over those 25 candles, so one candle without a new extreme is worth 4 points. A reading of 72 means the high is seven candles old; 28 means the low is eighteen candles old. Another period gives another step size.
The Aroon condition starting is not enough on its own: the trend filter and the candle confirmation must agree as well, which can happen a candle or two later. Max bars after Aroon trigger gives up to 3 candles for that, so the 10:05 jump of Aroon Down to 100 on 1 October 2026 got its arrow at 10:10.
At least 10 candles, from Min bars between signals, and with Alternate Buy/Sell only each arrow must be the opposite of the previous one. In the XAUUSD M15 test of April 2026 the gaps were longer than the minimum, for example 24 and 21 candles on 7 April.
It compares the close of the signal candle with an exponential moving average over 50 periods: above it before a Buy, under it before a Sell. Require MA slope is off by default; turning it on also asks the average to point the same way as the arrow, at the cost of later arrows.
The panel always reports the newest candle and the last arrow printed, wherever the chart is scrolled. With the chart moved back to 1 October 2026, it still showed SELL 10.27 01:35 and Ranging, the live state of 27 October, while the arrows on screen belonged to the older candles.






Comments
Be the first to comment.