


Range Filter Trend Histogram MT4 works as an ADX histogram on MetaTrader 4 that labels the market as ranging or trending before it offers any trade. Its bars stay grey while Trend power is under 20, the Range / Trend threshold, and turn green or red once an uptrend or a downtrend gains enough strength. At the start of such a trend, a Buy Arrow under the candle, or a Sell Arrow over it, marks the earliest finished candle that clears every active filter.
Splits range from trend on MT4 with grey, green and red ADX trend-power bars around 20, and arrows the first candle of a new trend that passes its filters.
Range Filter Trend Histogram Specifications
In MetaTrader 4 the tool works in two places: a subwindow under the price chart holds the trend-power bars, and the chart itself receives arrows that are set only after the candle closes.
| Item | Details |
|---|---|
| Platform | MetaTrader 4 (MT4); also available for MT5 |
| Categories | Oscillators, Signal & Forecast |
| Indicator type | Trend, Breakout, Entry Exit |
| Skill level | Intermediate |
| Timeframes | Any; shown here on M15 |
| Trading style | Intraday, Day Trading |
| Markets | Forex, Commodities, Indices, Crypto, Stock (shown on XAUUSD) |
| Display | Trend power bars and their line in a subwindow, dashed 20 level; Buy / Sell arrows over and under the candles; panel rows Trend power, Market, Last signal |
| Alerts | None |
| Version | 1.0 |
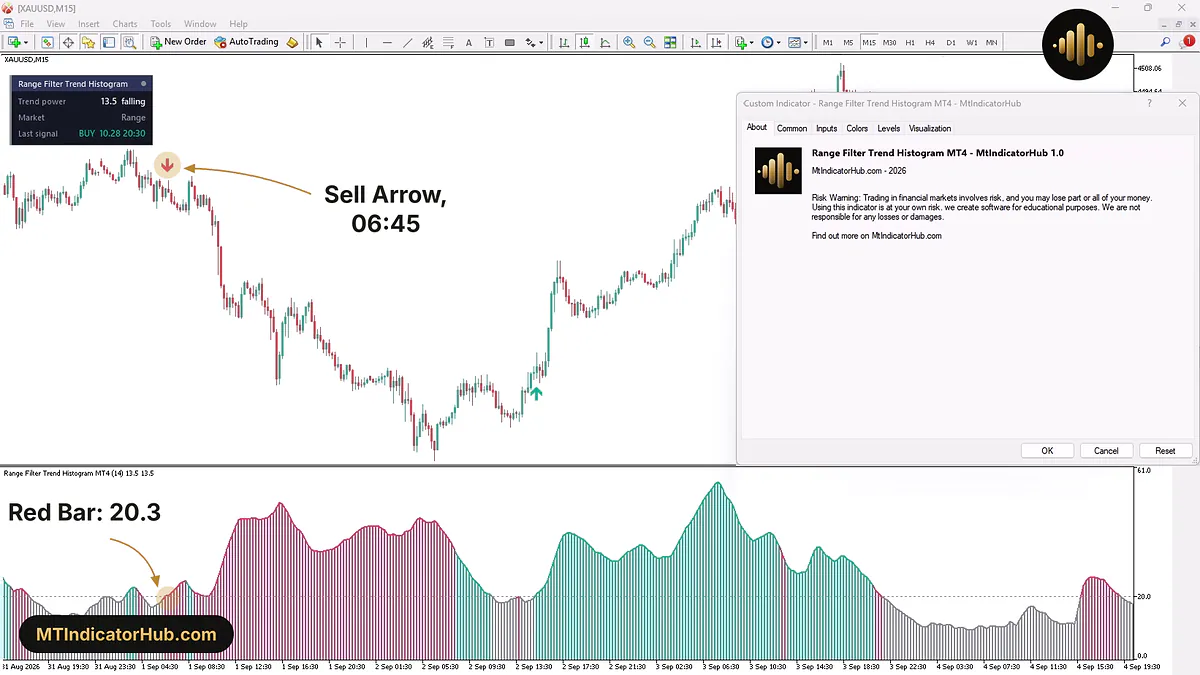
In the Custom Indicator window, the About tab carries the build name, Range Filter Trend Histogram MT4 - MtIndicatorHub 1.0. Behind it, the panel in the upper left corner reads Trend power 13.5 falling with Market on Range, and the subwindow label reads Range Filter Trend Histogram MT4 (14).
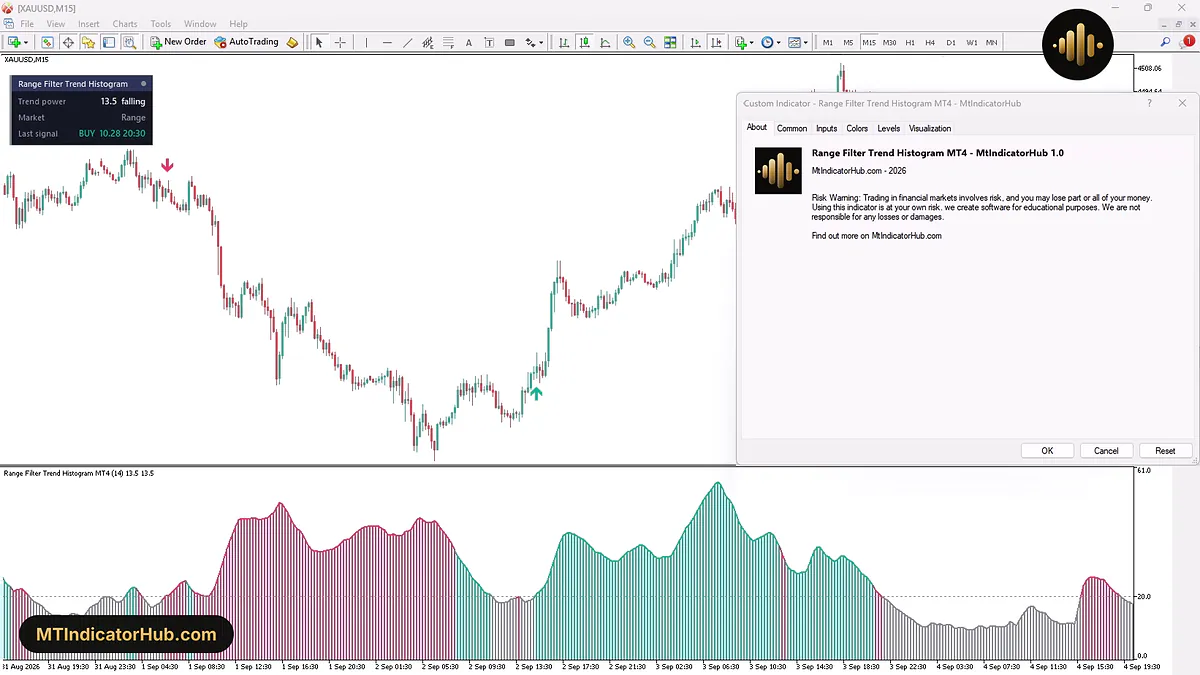
What Is the Range Filter Trend Histogram Indicator?
The Range Filter Trend Histogram indicator asks one question of every candle: is price moving in one direction strongly enough to count as a trend? The answer is Trend power, a reading made from ADX together with the DI+ and DI- lines over the Filter period (ADX / DMI), set to 14 candles. The higher the bar, the stronger the move, up or down alike.
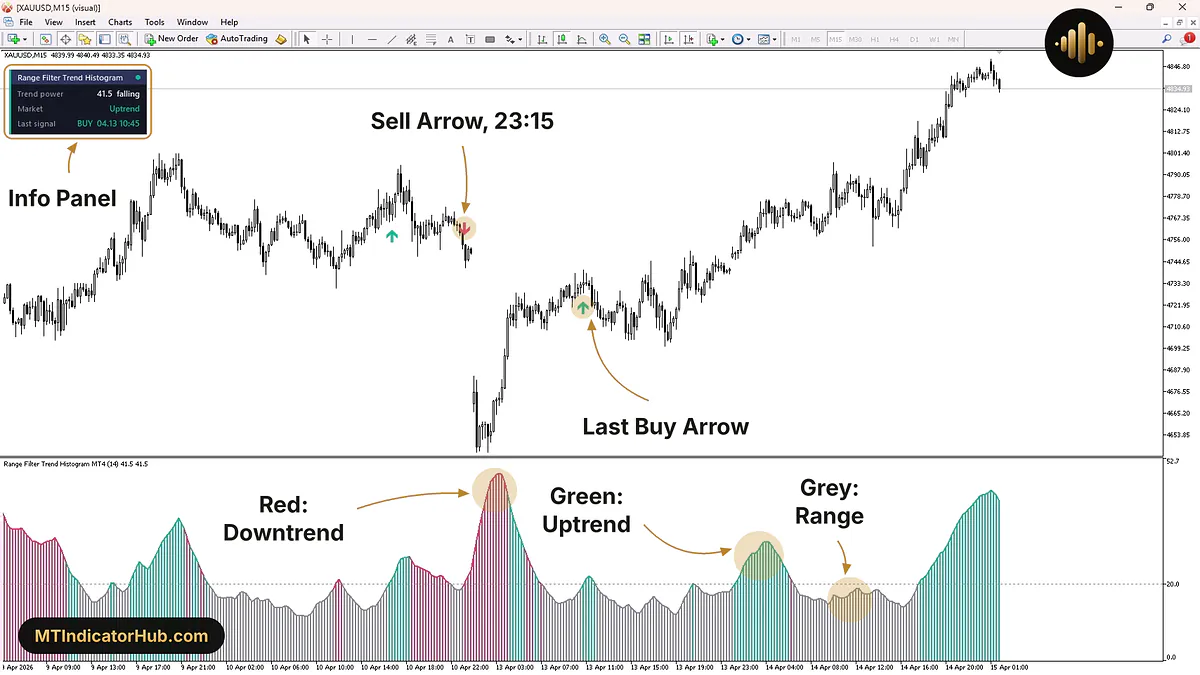
Colour adds the direction. Grey bars sit under 20, the dashed level of the Range / Trend threshold, and stand for a range. Above that level a bar turns green when the upward side leads, which the indicator treats as a strong uptrend, or red when the downward side leads, a strong downtrend.
On MT4 the reading also appears as numbers in the subwindow label: Range Filter Trend Histogram MT4 (14) is followed by the current value twice, once for the bars and once for the line along their tops. The (14) is the Filter period.
The info panel puts the same reading into words. Its Trend power row adds rising or falling, the Market row picks Uptrend, Downtrend or Range, while the Last signal row keeps the time, date and direction of the most recent arrow.
A visual test on XAUUSD M15, from 9 April to 15 April 2026, shows all of this on one screen: Buy on 10 April at 16:45, Sell at 23:15, then Buy on 13 April at 10:45, the arrow the Last signal row names.
Buy Signal
The Buy Arrow is printed once per uptrend, under the first rising candle of it that the filters accept. Green bars that follow add nothing new; as long as Alternate Buy / Sell only remains on, the next arrow on the chart has to be a Sell.
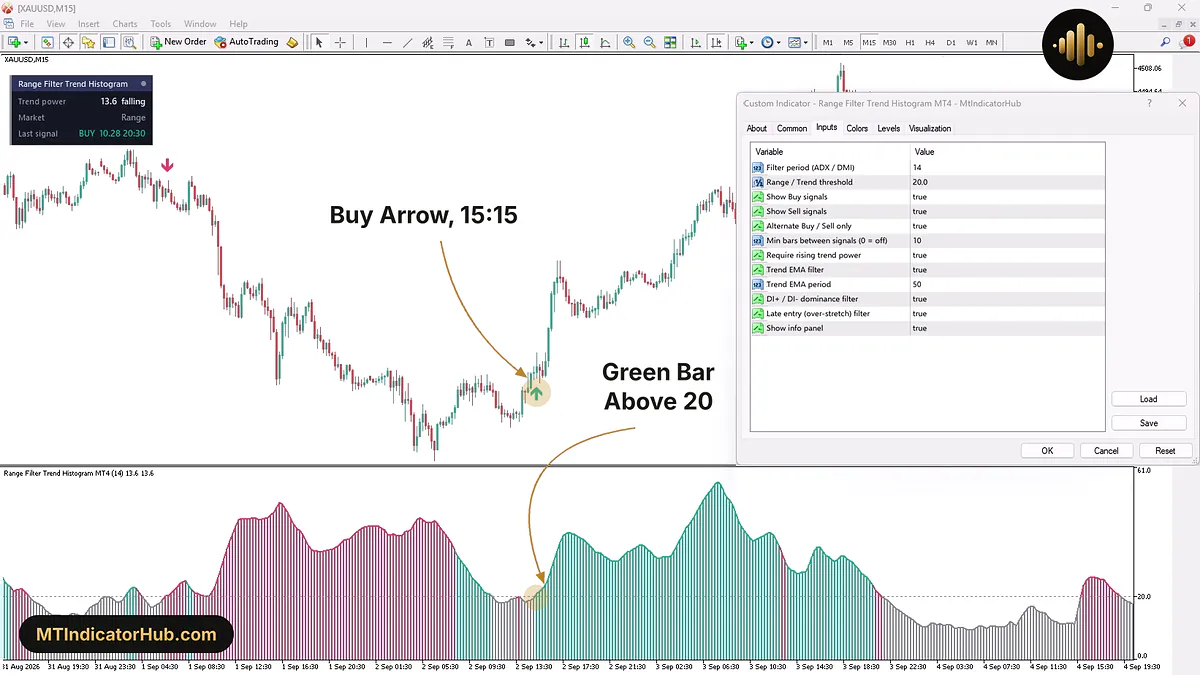
On XAUUSD M15 on 2 September 2026, green bars were on screen long before the Buy Arrow. Between 08:30 and 11:15 Trend power was fading, about 33.0 at 08:30 and 21.0 by 11:00, and Require rising trend power, on by default, blocks any arrow while the reading drops. At 11:45 the bar went grey on a reading of 18.7.
The arrow came at 15:15, when the reading turned back up across 20, to about 20.9, on a candle that finished above its open, with a close near 4336.75. Its low, near 4330.05, is where a protective stop fits best. The 16:00 candle tested that area and held: it opened at 4331.48, dipped to 4330.57, about 0.52 above that low, and closed at 4339.51 as the reading climbed to 23.7.
By 18:00 the reading stood at 40.3. On 3 September the 08:00 candle hit 4440.28, about 103.53 higher than where the arrow candle closed, and the green colour lasted 84 candles in all, ending with the 13:00 candle of that day. The first bar that is no longer green is where a long trade built on this arrow loses its reason.
Sell Signal
A Sell Arrow needs the opposite picture: a red bar at 20 or higher and a candle that ends below its open. The arrow then appears over that candle's high.
XAUUSD M15 on 1 September 2026 came out of a quiet morning, with Trend power at 17.4 on the grey 05:45 bar. After that grey stretch the 06:30 bar turned red, yet its candle finished higher than it opened, so nothing was drawn. One candle later the picture was complete: the 06:45 candle, with an open of 4438.48, rose to 4443.53 and closed at 4436.59, exactly its low, as Trend power reached 20.3. The Sell Arrow sits above it.
A stop over that high would be 6.94 from the close. The fall that followed went much further: by 16:30 Trend power was up to 49.0, and on 2 September at 04:45 price hit a low of 4288.30, 148.29 below the arrow candle's close.
Later on 2 September another red bar touched the line, 20.1 at 13:45, and still no Sell Arrow came. That candle closed slightly up, from 4309.29 to 4309.37, and the last arrow on the chart was already a Sell, which Alternate Buy / Sell only does not repeat. By 14:00 the reading was back under 20, at 19.1.
Indicator Settings
MetaTrader 4 has no input groups, so the Inputs tab lists all 12 settings of the indicator in a single column.
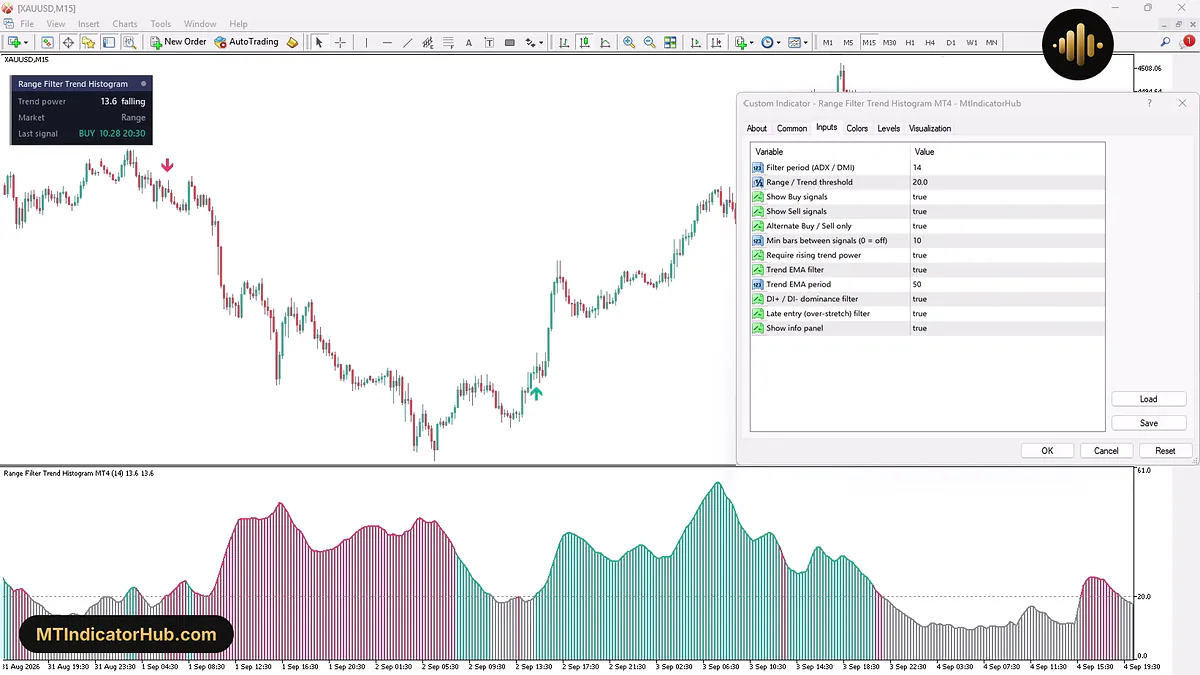
The first two rows set the measurement of Trend power and the end of a range, the next five control which arrows appear and how often, and four more add checks around a 50-period exponential moving average. The last row is for the panel, and all eight true / false switches load as true.
| Input | Default | What it changes |
|---|---|---|
| Filter period (ADX / DMI) | 14 | Number of candles the ADX and the DI+ / DI- lines read to build Trend power |
| Range / Trend threshold | 20.0 | Level where grey range bars end and coloured trend bars begin; raise it to accept only stronger trends |
| Show Buy signals | true | Turns the Buy Arrows on or off |
| Show Sell signals | true | Turns the Sell Arrows on or off |
| Alternate Buy / Sell only | true | After a Buy the next arrow must be a Sell, and the reverse |
| Min bars between signals (0 = off) | 10 | Fewest candles allowed between two arrows; 0 lets them come closer |
| Require rising trend power | true | No arrow while Trend power is dropping |
| Trend EMA filter | true | Buy Arrows need price over a rising EMA, Sell Arrows price under a falling EMA |
| Trend EMA period | 50 | How many candles that EMA averages |
| DI+ / DI- dominance filter | true | Waits until one side, buyers or sellers, clearly leads |
| Late entry (over-stretch) filter | true | Drops the arrow when price is already far from the EMA |
| Show info panel | true | Turns the Trend power / Market / Last signal panel on or off |
Filter period, Min bars between signals and Trend EMA period all count candles. On M30 that means 7 hours of data behind Trend power, at least 5 hours between two arrows and 25 hours for the EMA; on H4 the Filter period alone covers 56 hours.
Conclusion
Range Filter Trend Histogram MT4 is built to tell trending candles from ranging ones by a single ADX-based reading against the 20 level, and to put an arrow only where a new trend first passes its checks.
Fourteen candles of directional movement stand behind each bar, so a trend is confirmed after it has begun, and no arrow is fixed before its candle closes. Colour on its own is never a signal: a dropping Trend power, the spacing in candles, the EMA, DI and late-entry filters or the rule that sides take turns can each leave a coloured bar without an arrow. The panel always speaks about the newest candle, which no longer fits the screen once the chart is scrolled back, and the inputs include no alert, so new arrows have to be watched on the chart.
Your rating
Rate this indicator
How useful was this indicator? Click a star.
FAQ
Frequently asked questions
It is the indicator's single reading, built from ADX and the DI+ and DI- lines over the Filter period, 14 candles by default. It measures the strength of the current move only; the bar colour gives its direction, green with buyers ahead and red with sellers ahead. The panel shows the same number with the word rising or falling.
Ten by default, through Min bars between signals; a value of 0 removes the gap. On 1 September 2026 the green bars at 08:30 and at 08:45 stood just 7 and 8 candles past the 06:45 Sell Arrow, so the indicator could not answer them with a Buy.
The panel follows the live candle at the right edge. After you scroll back, all three panel rows still describe that newest bar, and so do the two values in the subwindow label, while the bars and arrows on screen belong to older candles.
With Trend EMA filter at true, a Buy Arrow needs price above an EMA that is rising, and a Sell Arrow needs price below one that is falling. Trend EMA period sets its length, 50 by default; switching the filter off removes this condition, so arrows no longer depend on that average.
It goes to the earliest candle closing below its open while its histogram bar shows red at 20 or more, Trend power is rising and every switched-on filter agrees. On 1 September 2026 the 06:30 bar already showed red while its candle ended higher than it opened, so the arrow waited for 06:45, a candle that closed at 4436.59, its low.






Comments
Be the first to comment.