



On MetaTrader 5, the ICT Killzones indicator shades the busiest opening hours of the trading day: one box each for the Asian, London, New York AM and New York PM killzones, with the session name written above it. The upper and lower edges of every box are extended to the right as a green and a red line, so each killzone's high and low remain on the chart for the rest of its session.
Draws the Asian, London, New York AM and New York PM killzones of each day on MT5, with every box's high and low carried on as green and red lines.
ICT Killzones Specifications
In MT5 the boxes, lines and names all sit on the price chart, and the MT5 build draws them on timeframes up to M30, one step lower than the MT4 build.
| Item | Details |
|---|---|
| Platform | MetaTrader 5 (MT5); also available for MT4 |
| Categories | ICT, Price Action |
| Indicator type | Session & KillZone |
| Skill level | Advanced |
| Timeframes | M1-M5 and M15-M30 (nothing is drawn above M30 in MT5); shown here on M5, M15 and M30 |
| Trading style | Scalper, Intraday, Day Trading |
| Markets | Forex, Indices, Commodities, Crypto (shown on BTCUSD) |
| Display | A coloured box per killzone, Khaki for Asian, CornflowerBlue for London, MediumTurquoise for New York AM and Salmon for New York PM, the session name above it, plus green lines on the highs and red lines on the lows |
| Alerts | None |
| Version | 1.0 |
What Is the ICT Killzones Indicator?
A killzone, in ICT terms, is a fixed window at the start of a trading session, and the ICT Killzones indicator draws four of them every day on an MT5 chart. Trading in the forex market never stops between Monday and Friday, it only moves from Asia to Europe and on to America, and the indicator follows that path with an Asian, a London, a New York AM and a New York PM box.
Where a session begins is built into the tool. What you set is the duration of every killzone, entered as hours plus minutes; out of the box, Asian runs for 4 hours 55 minutes, London for 2 hours 55, New York AM for 2 hours 25 and New York PM for 3 hours 25. Inside that window the box rises to the highest high and drops to the lowest low of the candles it covers.
Every killzone also gets two lines. A green one leaves the top edge of the box and a red one the bottom edge, and they continue past the box to the close of the session, which turns the killzone range into a pair of reference levels for the hours that follow. Lines and box are laid out in full the moment a session starts: on 5 May the London lines already reach 17:30 while the newest candle is 15:45, and only the height of a running box can still change.
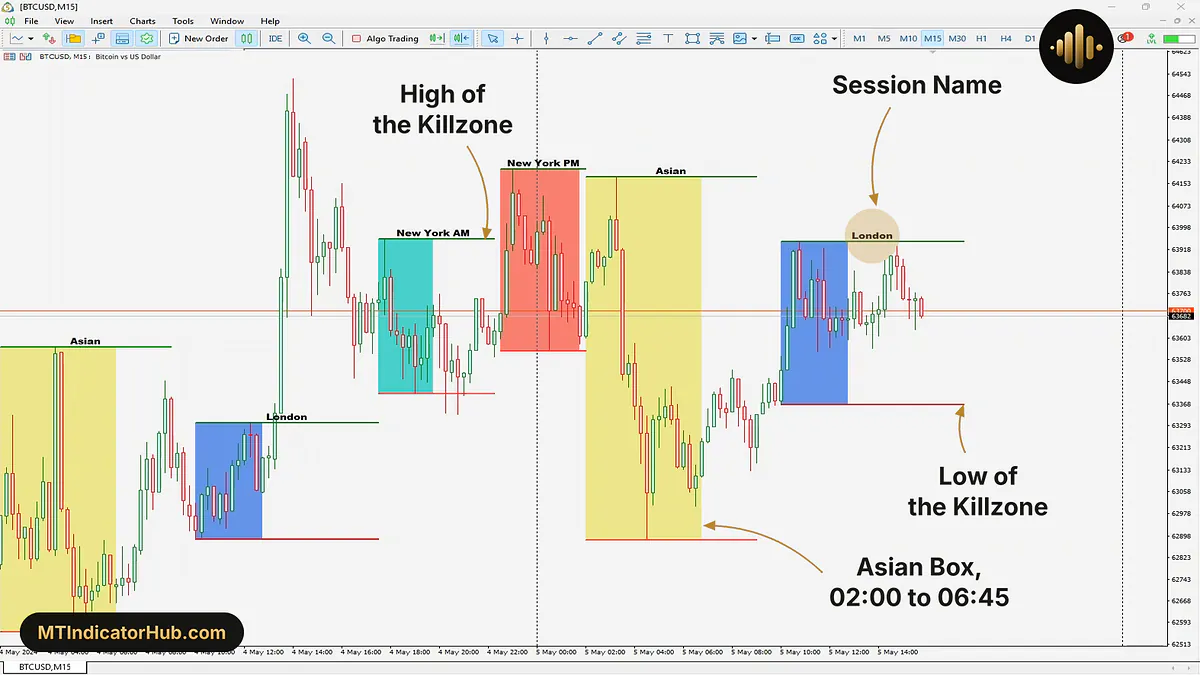
The BTCUSD M15 chart of 4 and 5 May 2024 shows the four in their daily order, starting at 02:00, 10:00, 17:30 and 22:30 by the chart's time scale. The Asian box of 5 May is the widest and also the tallest in view: it covers 02:00 to 06:45, spans about 62887 to 64179, a range near 1292, and its green and red lines stop at 09:00.
Indicator in an Uptrend
A rising market moves the whole set of drawings up the chart, and a strong climb can leave clear space between one box and the next.
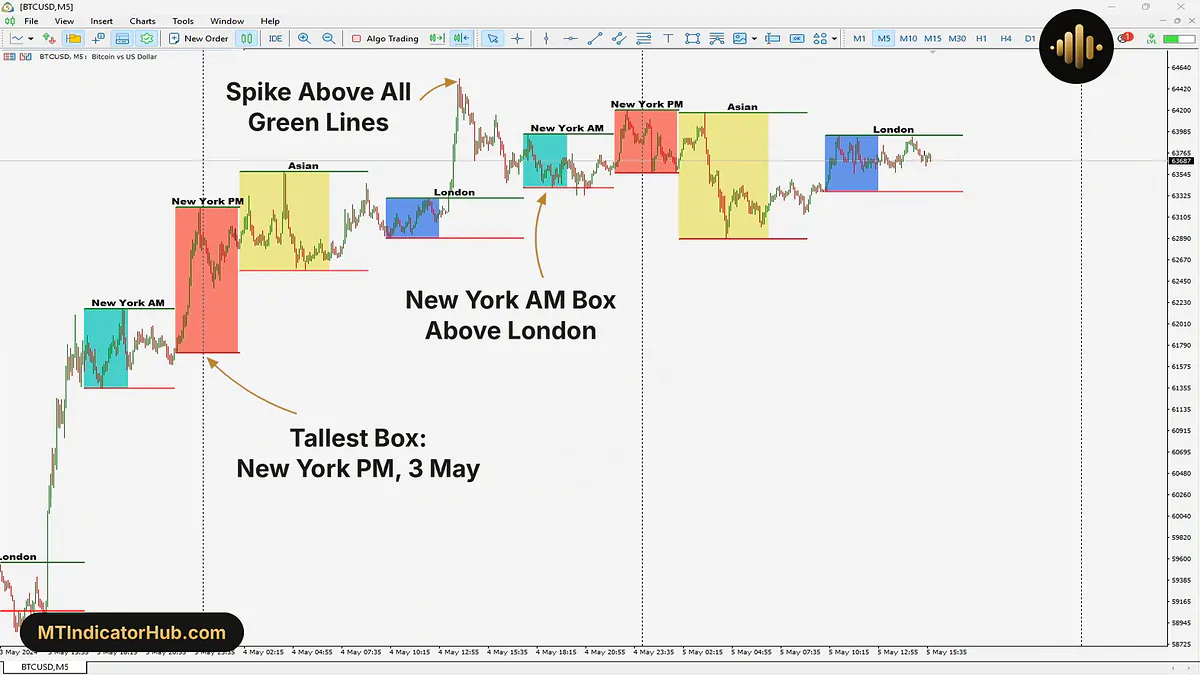
BTCUSD M5 from 3 to 5 May 2024 is a good example. The New York PM box of 3 May, from 22:30, is the tallest of the climb, because the buying carried on inside that killzone: it runs from about 61719 up to about 63213, close to 1494 from bottom to top. After it, the Asian box of 4 May held between about 62562 and 63578, and the London box that morning stayed inside that range, between about 62894 and 63306.
Then price jumped away from the London box. The M5 candle of 14:00 on 4 May opened at 64408, peaked at 64526 and closed at 64354, well over every green line drawn before it, and those lines stayed exactly where their killzones had set them. When the New York AM box opened at 17:30 it sat fully above the London box, its low near 63412 still higher than the London high of about 63306.
The New York PM killzone of 4 May then printed the highest box top so far, about 64182, and its red line near 63565 sat over all the earlier ones. The Asian box of 5 May was the first to reach below that line, down to about 62888.
Indicator in a Downtrend
In a falling market the gaps open the other way: a new box can form completely under the previous box's red line.
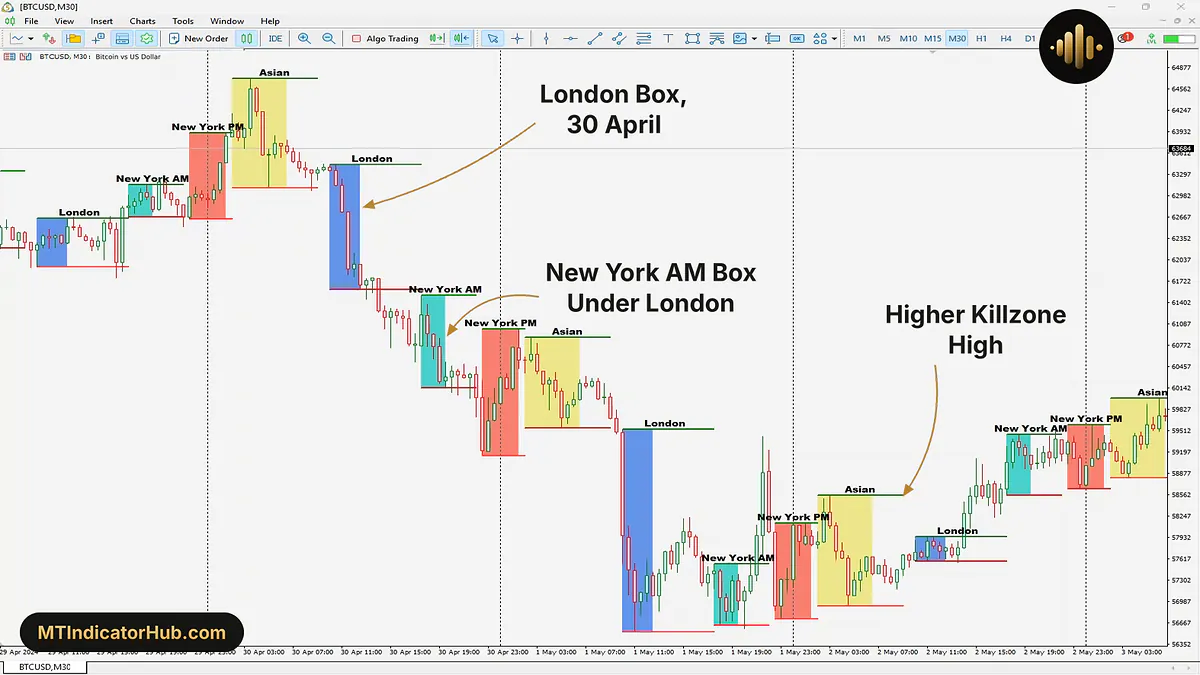
On BTCUSD M30, the London killzone of 30 April took price from about 63452 down to about 61605, a box close to 1847 tall. The New York AM box that followed at 17:30 topped out near 61519, already under that London low, and the New York PM box later that night stayed lower again, between about 59147 and 61022. London on 1 May then carried the sell-off from about 59539 to about 56545 within six M30 candles.
The turn shows up on the green lines. The 1 May New York AM box still printed a lower high, near 57549, but the following New York PM box reached about 58152, the first killzone high since 30 April's Asian killzone to rise above the previous session's green line. The next Asian box, on 2 May, went further, to about 58563, while every box kept its colour: the indicator marks time and range only, and the change of direction is read from the levels.
Indicator Settings
Each of the four sessions has its own block of inputs under a text header, and a single Theme setting closes the list.
The Hour Buffer and Min Buffer of a session add up to the length of its killzone, measured from the moment the session opens, and its Color input fills the box. The header rows, Asian Section to New York PM Section, are labels for the blocks and draw nothing.
| Input | Default | What it changes |
|---|---|---|
| Asian Section: the Asian killzone box | ||
| Asian Killzone Hour Buffer | 4 | Hours in the Asian killzone |
| Asian Killzone Min Buffer | 55 | Extra minutes of the Asian killzone |
| Asian Killzone Color | Khaki | Colour of the Asian box |
| London Section: the London killzone box | ||
| London Killzone Hour Buffer | 2 | Hours in the London killzone |
| London Killzone Min Buffer | 55 | Extra minutes of the London killzone |
| London Killzone Color | CornflowerBlue | Colour of the London box |
| New York AM Section: the New York AM killzone box | ||
| New York AM Killzone Hour Buffer | 2 | Hours in the New York AM killzone |
| New York AM Killzone Min Buffer | 25 | Extra minutes of the New York AM killzone |
| New York AM Killzone Color | MediumTurquoise | Colour of the New York AM box |
| New York PM Section: the New York PM killzone box | ||
| New York PM Killzone Hour Buffer | 3 | Hours in the New York PM killzone |
| New York PM Killzone Min Buffer | 25 | Extra minutes of the New York PM killzone |
| New York PM Killzone Color | Salmon | Colour of the New York PM box |
| Theme: the session names on the chart | ||
| Theme | White Theme | Label colour suited to a pale or a black chart background; black text with White Theme |
The lengths are clock time, so lower timeframes split a killzone into more candles. New York AM, 2 hours 25 minutes long, spans 29 candles on M5 (17:30 to 19:50), 10 on M15 and 5 on M30, and the 3 hours 25 minutes of New York PM take 41, 14 and 7. On H1 and above, the MT5 build leaves the chart without boxes.
Conclusion
On MT5, the ICT Killzones indicator turns each trading day into four marked windows with fixed starting points and lengths of your choice, and the box and two lines of every window record how high and how low price went while it was open.
What it leaves to the trader is the reading. A box looks the same whether the market rose or fell inside it, so the trend shows only in how the boxes and their lines step from one session to the next. Moves that happen between killzones are not boxed, and price crossing one of the lines raises no arrow or alert. Session openings are not among the inputs, the lines end with their session, and the MT5 version stops drawing above M30.
Your rating
Rate this indicator
How useful was this indicator? Click a star.
FAQ
Frequently asked questions
The MT5 build shows its boxes only on M30 and lower timeframes. On H1, H4 and the daily chart the killzones are not drawn, so switch to M30, M15, M5 or M1 to see them. On M30 a London window still fills 6 candles.
No. The start of each session is fixed inside the indicator, and no input moves it. You can lengthen or shorten every killzone with its Hour Buffer and Min Buffer and pick its colour, but each box always begins at its own session open.
Yes. As soon as a session opens, its box is laid out across the whole killzone, reaching ahead of the latest candle, and its green and red lines run to the session's end. While the killzone is still running, the box's high and low edges move whenever price makes a new high or a new low inside it.
Out of the box, Asian boxes are Khaki, London ones CornflowerBlue, New York AM ones MediumTurquoise and New York PM ones Salmon, while the high lines are green and the low lines red. Every session has its own Color input for the box, and Theme decides how the session names are coloured.





Comments
Be the first to comment.