


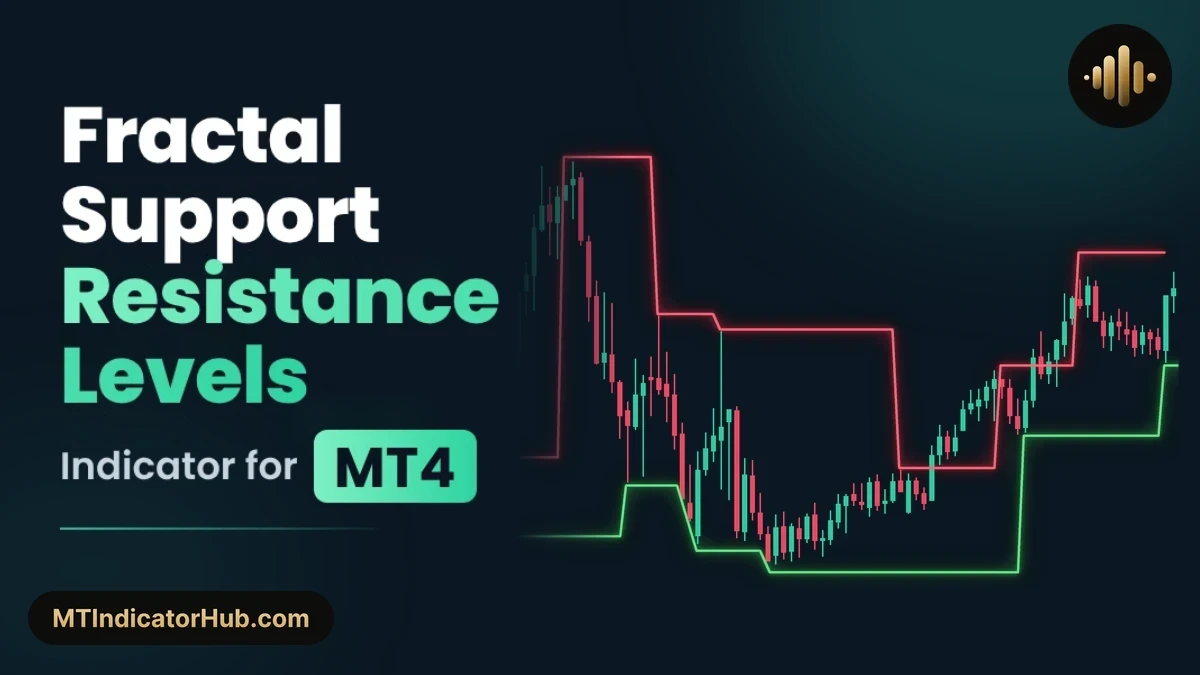
On MetaTrader 4, Fractal Support Resistance Levels draws two stepped lines straight over the candles: red at the most recent swing high that has been confirmed, green at the most recent confirmed swing low. A three-row panel then checks where the previous candle closed against them and labels the market Bullish, Bearish or Ranging.
On MT4, draws the most recent swing high and swing low as red and green steps, and a three-row panel labels the previous close Bullish, Bearish or Ranging.
Fractal Support Resistance Levels Specifications
Nothing opens in a separate window: lines and panel share the price chart, and at the default sensitivity eight bars of history are enough to begin.
| Specification | Detail |
|---|---|
| Platform | MetaTrader 4 (MT4); an MT5 version is available too |
| Categories | Support & Resistance, Price Action |
| Indicator type | Levels, trend and range state |
| Skill level | Beginner |
| Timeframes | Any; shown here on M15 |
| Trading style | Intraday, swing trading |
| Markets | Forex, gold, indices, crypto, stocks |
| Display | Red and green step lines over the candles, plus a panel with Resistance, Support and Market rows at the upper left |
| Alerts | None |
| Version | 1.0 |
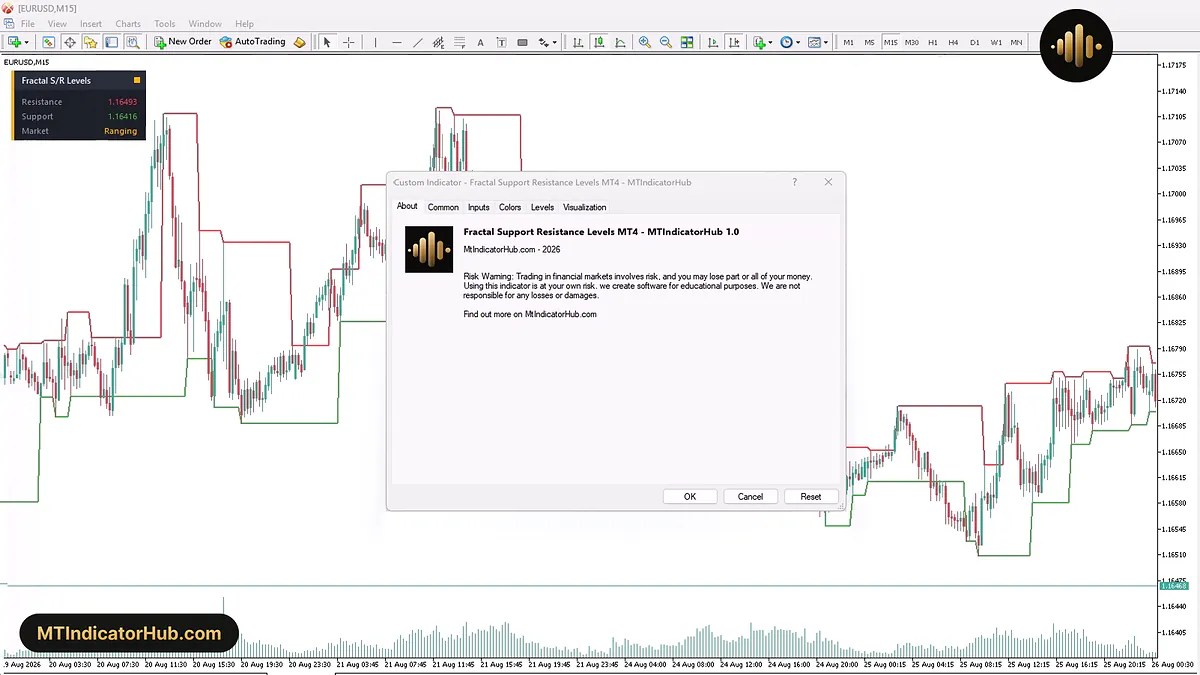
The About tab hides most of the EURUSD M15 chart, yet the panel at its upper left still lists 1.16493 for Resistance and 1.16416 for Support, with Ranging under them.
What Is the Fractal Support Resistance Levels Indicator?
Every level begins as a fractal. One candle with three lower highs to its left and three to its right marks a swing high; one with three higher lows on both sides marks a swing low. Dropping Pivot bars each side to 2 reproduces the classic five-bar pattern from Bill Williams, while the default of 3 stretches the test across seven bars and lets smaller turns pass.
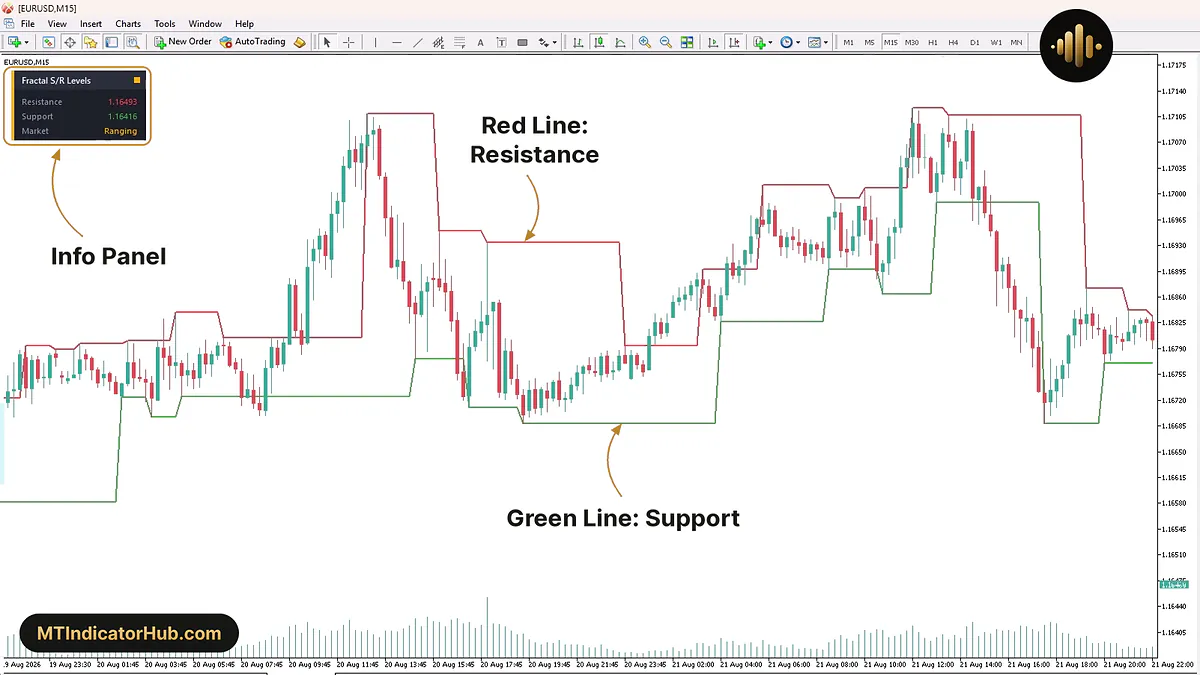
Red traces resistance at the price of the most recent swing high, and green traces support at the price of the most recent swing low. Neither line moves while no fresh swing forms; when one does, the line steps to its price, and those steps build the stair shape. Each flat stretch is a level of support and resistance still in force. MetaTrader 4 also lists both values, as Resistance and Support, for every bar in its Data Window.
Fractal S/R Levels, the dark panel in the upper left corner, prints Resistance and Support in their line colours and adds a Market row. Bullish in green means the previous candle closed over the red line, Bearish in red means it closed under the green line, and amber Ranging covers every close from one line to the other. A thin bar down the panel's left side and a dot in its header take the same colour, so the state shows at a glance.
Indicator in an Uptrend
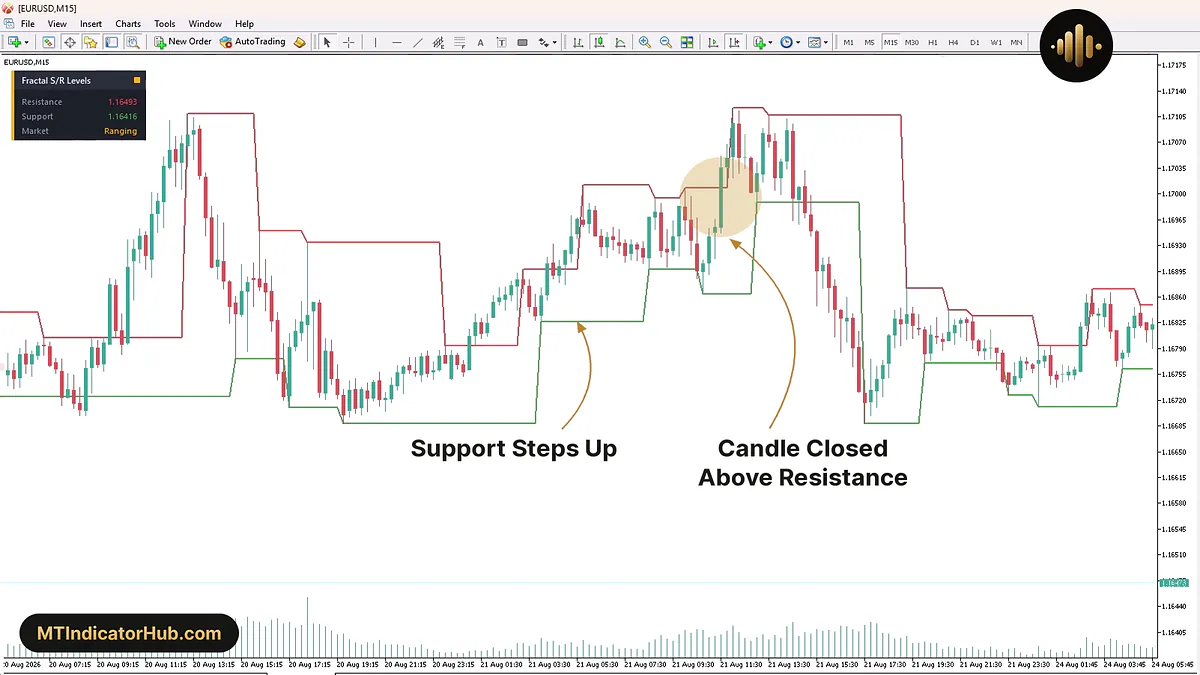
While swing lows keep rising, the green line climbs behind the candles one step at a time. Red is the hurdle: the panel prints Bullish only after a candle finishes above it, and the side bar and dot go green at that same close.
On 21 Aug the green line climbed from about 1.16688 to 1.16827 and then 1.16898 as pullbacks held higher. At 11:30 a candle finished near 1.17036, over the red step at 1.17009, and the next two kept going to around 1.17095; a finished close over red is what puts Bullish on the panel.
Long trades can tuck the stop under the green step, at about 1.16865 when that candle closed, because a close beneath it would put Bearish on the panel. A close back under the broken red step that holds above support only brings Ranging back.
Indicator in a Downtrend
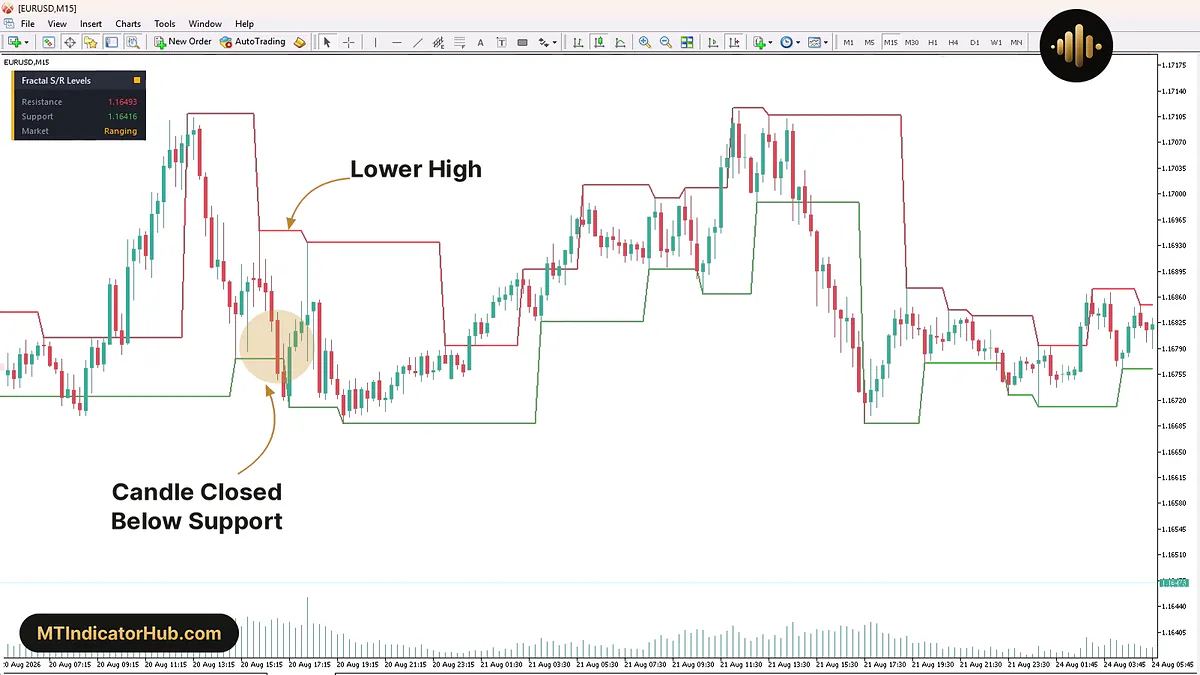
As lower highs form, red walks down over the candles, and green holds the swing low that a decline has to clear. After a close under green, the panel switches to Bearish in red.
Look at 20 Aug after the 1.17108 top. Red had already dropped to about 1.16950, a lower high, when the 16:45 candle finished near 1.16756, under the 1.16777 support. Only that finished close matters to the panel, and the next candle ended lower still, near 1.16725. Shorts can keep the stop at the red step of 1.16950, close to 20 pips above the break.
Indicator Settings
MetaTrader 4 opens the indicator in a Custom Indicator window, and its Inputs tab carries five settings in one column.
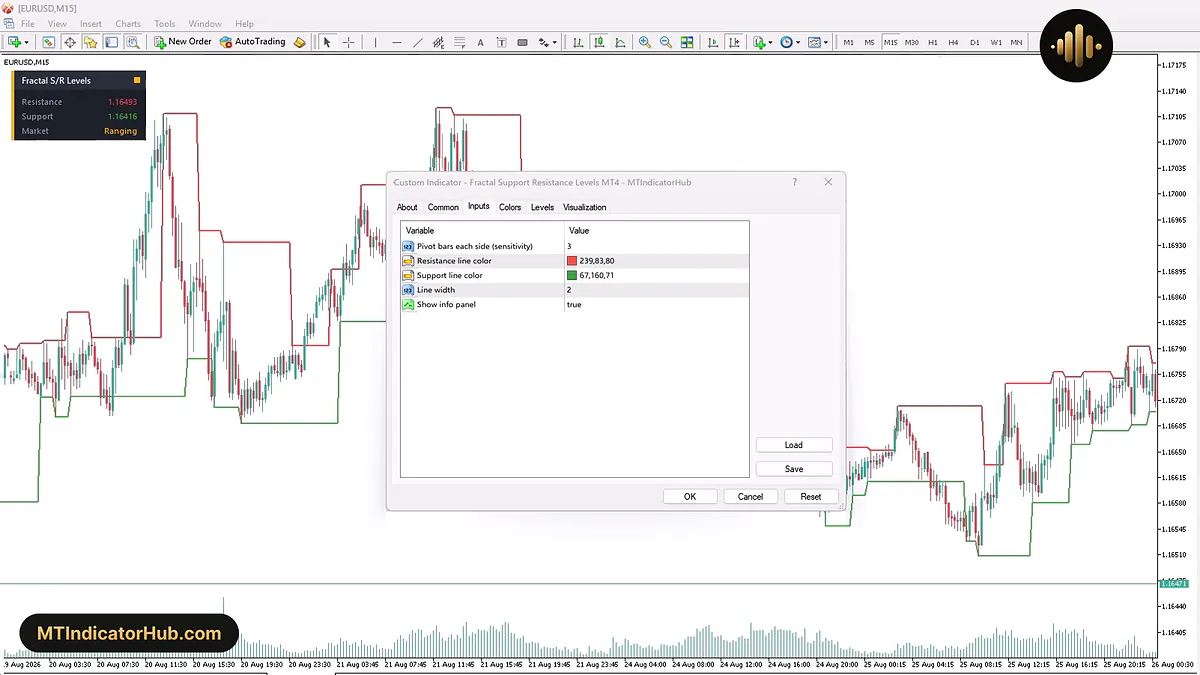
Of the five, only the sensitivity value decides where levels form. Colour, width and the panel switch change how the chart looks, not what it measures.
| Input | Default | Effect |
|---|---|---|
| Pivot bars each side (sensitivity) | 3 | How many candles must sit on both sides of a swing; raising it keeps only bigger turns and delays them, lowering it adds smaller turns sooner (1 at the lowest) |
| Resistance line color | 239,83,80 | Red of the resistance steps and of the panel's Resistance price |
| Support line color | 67,160,71 | Green of the support steps and of the panel's Support price |
| Line width | 2 | How thick both lines are drawn |
| Show info panel | true | Turns the Fractal S/R Levels panel on or off |
On the M15 chart used here, the default of 3 means a swing covers an hour and three quarters of trading, and its step arrives 45 minutes after the swing candle. On H1 that same wait grows to three hours.
Conclusion
Two lines and one word sum up the tool: the last swing high, the last swing low, and whether the previous close sits above, below or inside them.
Waiting for three candles on the far side of a swing keeps levels honest but late, so after a sharp move the newest step can lag behind price. Older steps stay visible as history, yet only the latest high and low feed the panel, and no level is scored for strength. One close past a line is enough to change the Market row, so a choppy range can switch it several times. The indicator prints no arrows and sends no alerts, and its panel cannot leave the upper left corner of the chart.
Your rating
Rate this indicator
How useful was this indicator? Click a star.
FAQ
Frequently asked questions
A swing only counts once three candles exist after it, the same number as before it. Until then the candle could still be topped or undercut, so the line keeps the older level and steps to the new one on the third candle.
It repeats the Market row. Green follows a close above resistance, red a close below support, and amber any close between the two lines; the small dot in the panel header always matches it.
Yes. Point at any bar and the Data Window shows a Resistance and a Support value for it, which are the prices of the two steps on that bar.
Very little. With Pivot bars each side at its default of 3, eight bars are enough; at the minimum of 1, four will do. Larger values ask for a few more.






Comments
Be the first to comment.