


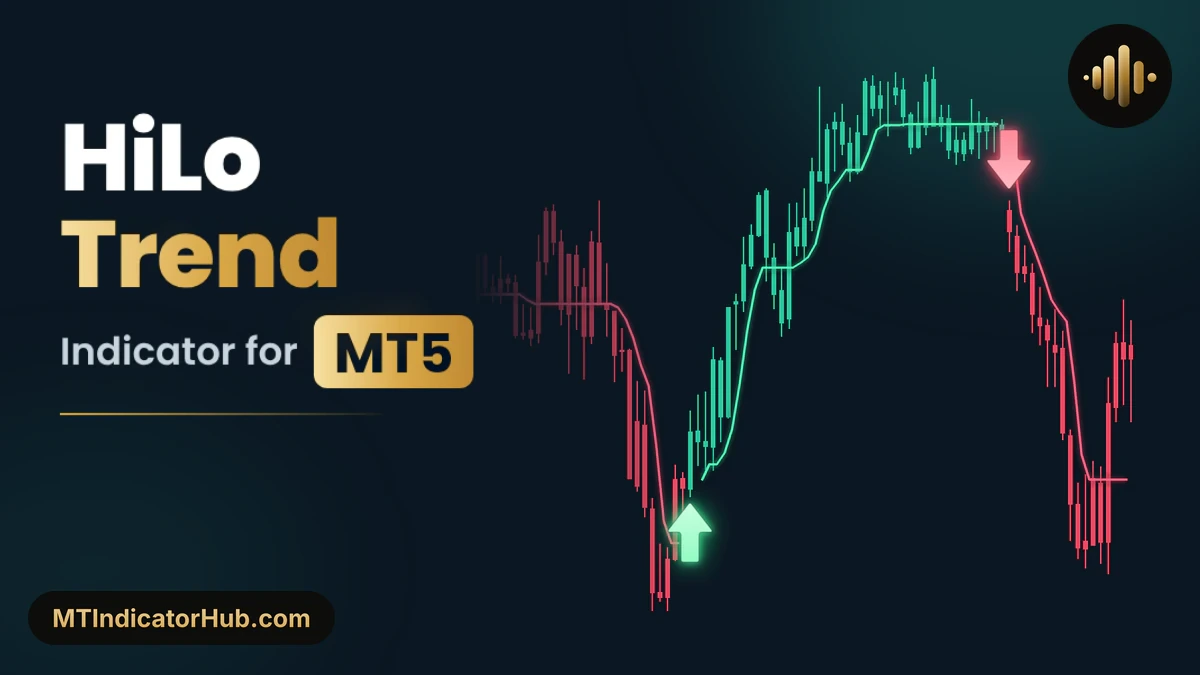
The HiLo Trend MT5 indicator tracks the recent highs and lows of price with a stepped level line, green beneath the candles in an uptrend and red above them in a downtrend, and paints every candle in the colour of that trend. Each closed candle that flips the trend gets an arrow, a Buy Arrow beneath it when the turn is up and a Sell Arrow over it when the turn is down, while an info panel keeps the current level, the market state and the last signal on screen.
Trails a green or red level from recent highs and lows, colours the candles by trend and prints a Buy or Sell arrow on the closed candle that flips it.
HiLo Trend Specifications
HiLo Trend Signals MT5 draws all of its output on the price chart itself, with no separate indicator window, and waits until a candle has closed before it places any arrow.
| Item | Details |
|---|---|
| Platform | MetaTrader 5 (MT5); also available for MT4 |
| Categories | Support & Resistance, Signal & Forecast |
| Indicator type | Trend, Reversal, Entry Exit |
| Skill level | Beginner |
| Timeframes | Any; shown here on M5 and M15 |
| Trading style | Scalper, Intraday |
| Markets | Forex, Commodities, Indices, Crypto, Stock (shown on XAUUSD) |
| Display | Green and red trailing level line, candles coloured by trend, Buy and Sell arrows and an info panel with Level, Market and Last Signal, all on the price chart |
| Alerts | None |
| Version | 1.0 |
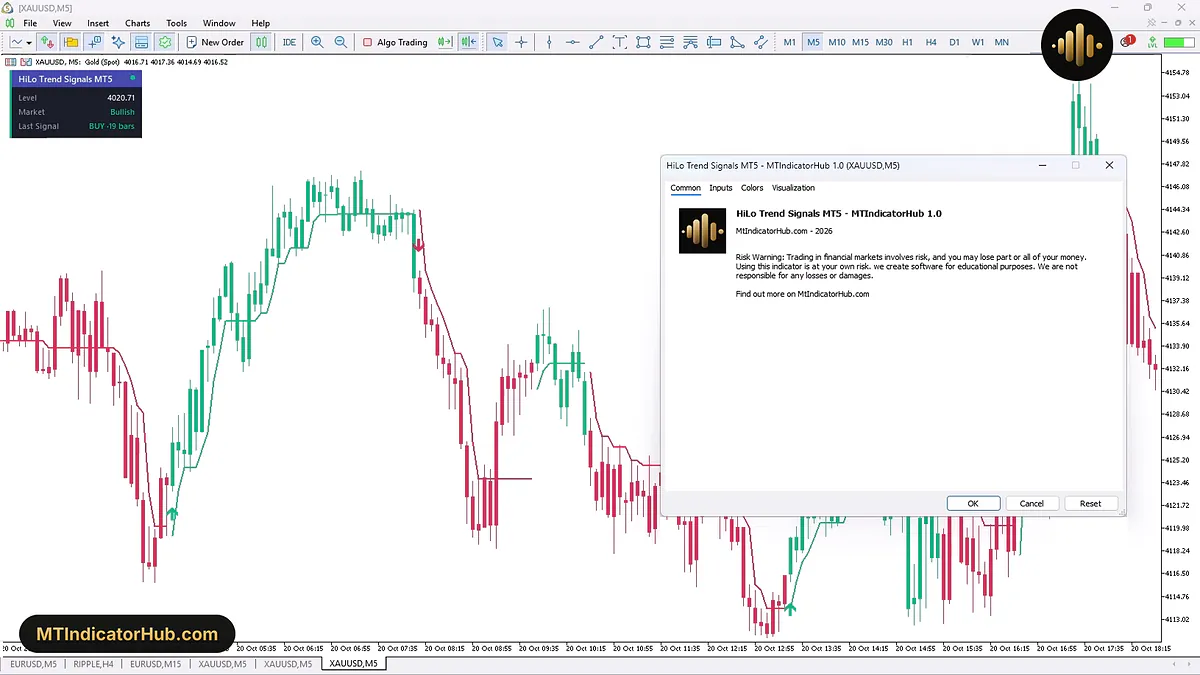
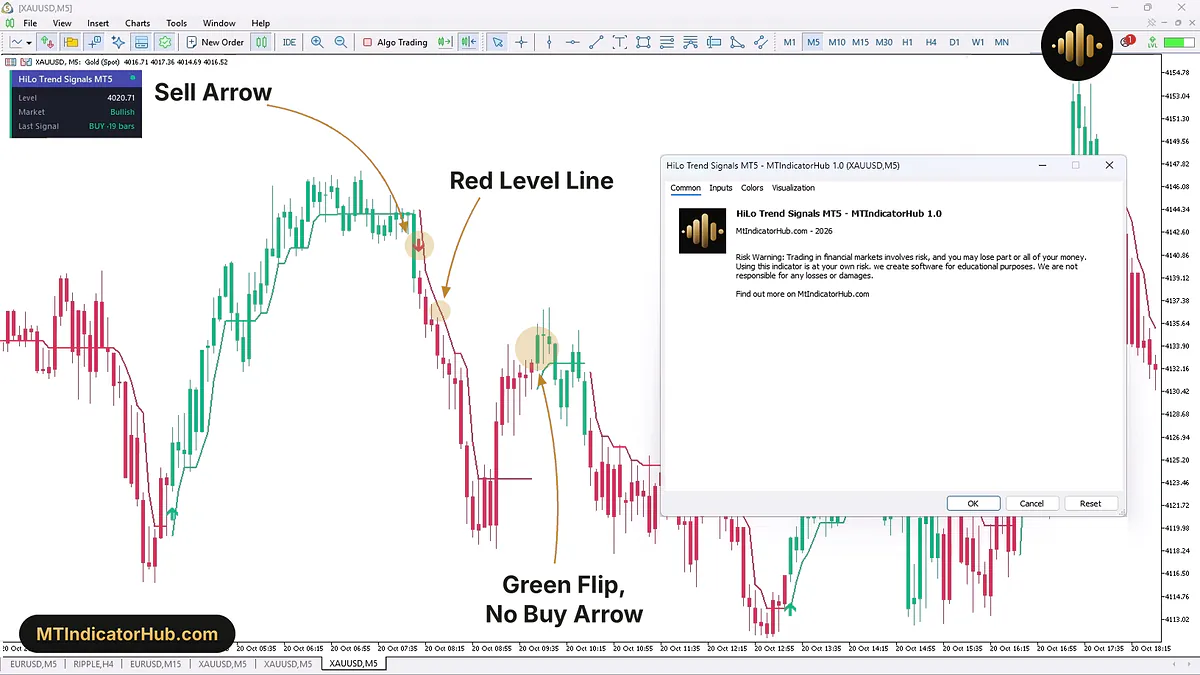
With the Common tab open, the info panel at the upper left of the XAUUSD M5 chart reads Level 4020.71, Market Bullish and Last Signal BUY ·19 bars, while the candles to the left of the dialog switch from red to green and back together with the level line.
What Is the HiLo Trend Indicator?
The HiLo Trend indicator is a trend-following tool for MetaTrader 5 that reads the market from the highs and lows of the last few candles. It averages the recent highs and the recent lows over 2 candles by default, the Channel length (bars) input, with a simple moving average unless High/Low MA method is changed, and from those averages it decides which side holds control.
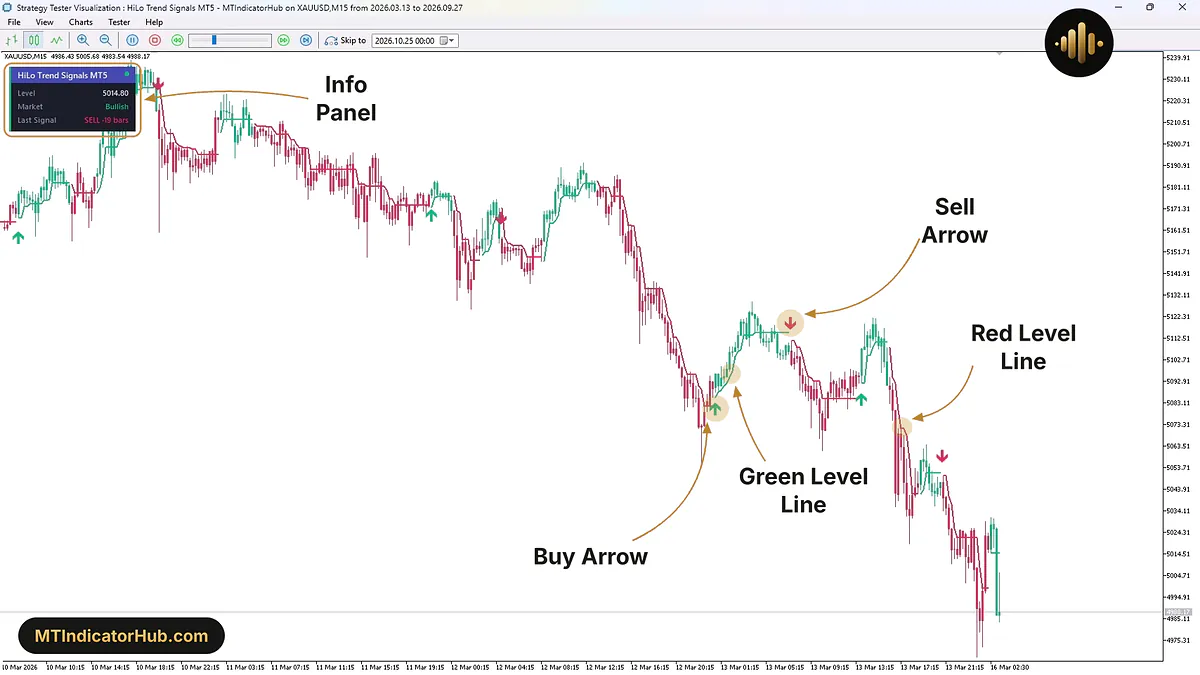
That decision is drawn as a trailing level line. While the trend is up, the line is green and runs under the candles, climbing in steps and holding flat between them; while the trend is down, it is red and sits over the candles, stepping lower as price falls. Because it trails price this way, the green line can be read as a moving support level and the red line as a resistance level.
With Color candles by trend switched on, each candle takes the colour of the trend rather than of its own open and close, so the chart shows at a glance which phase the market is in.
The info panel repeats the picture in words. Level is the current value of the level line, Market reads Bullish, Bearish or Neutral, and Last Signal names the latest arrow with the number of candles since it, for example BUY ·19 bars. The left edge of the panel and the dot in its title bar turn green or red with the trend.
On XAUUSD M15, a Strategy Tester run from 10 to 16 March 2026 ends with the panel on Level 5014.80 and Market Bullish, yet Last Signal still reads SELL ·19 bars: with Min bars between signals at 25, a Buy Arrow cannot follow that Sell yet.
Buy Signal
A Buy Arrow marks the closed candle on which the trend turns from bearish to bullish. Until then the level line runs red above price; once buyers carry price out of its reach, that candle closes in green, the level line reappears in green beneath it, and the arrow appears below the candle's low.
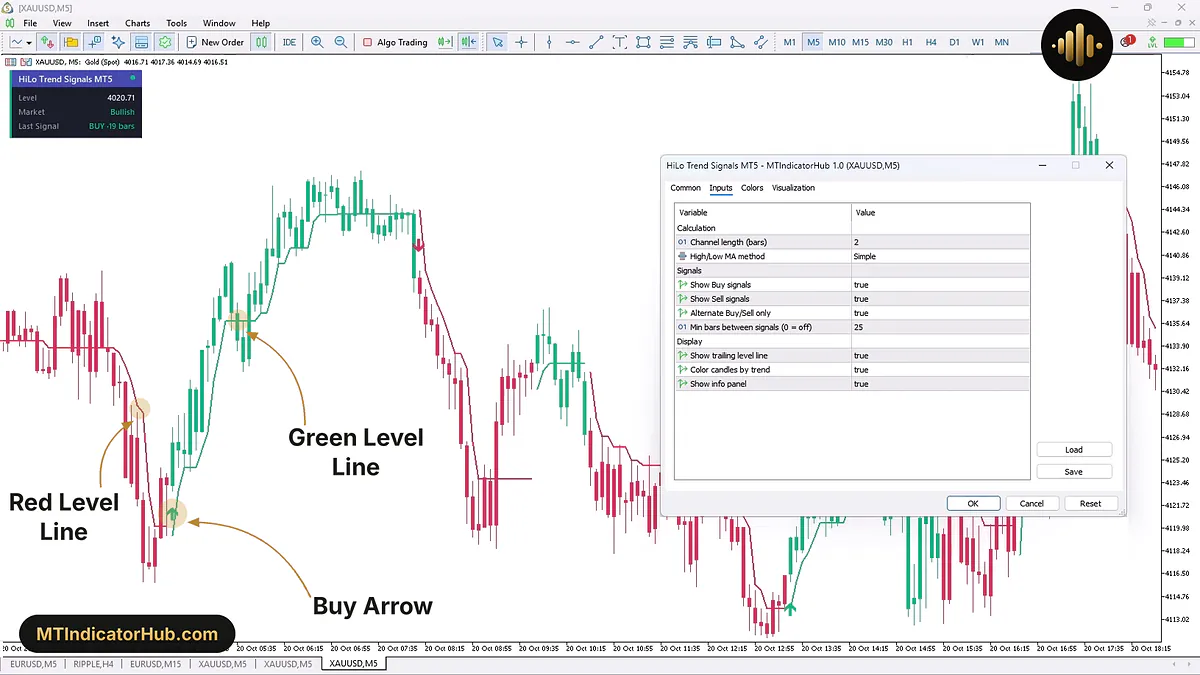
The example is XAUUSD M5 on the morning of 20 October 2026. The session opened bearish, with red candles under a red level that stepped down from about 4133.79 to about 4120.15, and the 04:25 candle reached a low of 4115.84. At 04:40 a candle opened at 4123.26, rose to 4127.66 and closed at 4126.50: the first green candle of the morning, with the Buy Arrow under it. The Data Window's HLTS Buy row for that candle reads 4121.77, the price where the arrow is drawn, 1.04 below its 4122.81 low.
From there the green level climbed under the candles in steps, holding near 4135.85 from 05:25 to 05:45 and near 4144.02 from 07:00 to 08:00, and by 07:15 a candle had reached 4146.83, 20.33 above the close of the arrow candle.
Taken as a long entry, the signal candle provides two levels: its 4126.50 close as the entry and its 4122.81 low, 3.69 lower, as the stop. After that, the green line works as a trailing stop guide, and the bullish phase lasted 42 candles, up to the Sell Arrow of 08:10.
Sell Signal
The Sell Arrow is drawn over the closed candle that turns the trend bearish, and at the same moment the green line under price gives way to a red line above it. Since candle colours follow the trend, a candle can fall hard and still be green when the trend has not flipped yet.
That is what happened later on the same chart. From 07:00 to 08:00 the green level stayed flat near 4144.02, and several candles closed a little under it, such as the 07:40 close at 4142.34, without changing the trend. The 08:05 candle then dropped from 4143.95 to 4139.11 and still came out green. The next one, at 08:10, opened at 4139.12, closed at 4137.90 and turned red: the trend had flipped, the Sell Arrow appeared above the candle, and a red level began stepping down over the candles.
By 09:00 price had slid to 4118.74, 19.16 under the close of the arrow candle, while the red level followed it down to about 4123.78. Sellers could place a stop over 4139.64, the top of the signal candle and 1.74 above its close, then follow the red line down as it steps lower.
The same stretch shows both arrow filters at work. At 09:50, only 20 candles after the Sell Arrow, the candles turned green and the level flipped under price, but no Buy Arrow appeared, because Min bars between signals keeps at least 25 candles between two arrows. At 10:35, 29 candles after the Sell, the trend turned bearish again, and this time Alternate Buy/Sell only held the arrow back, as the last one was already a Sell.
Indicator Settings
The Inputs tab lists 9 settings in three groups: Calculation, Signals and Display.
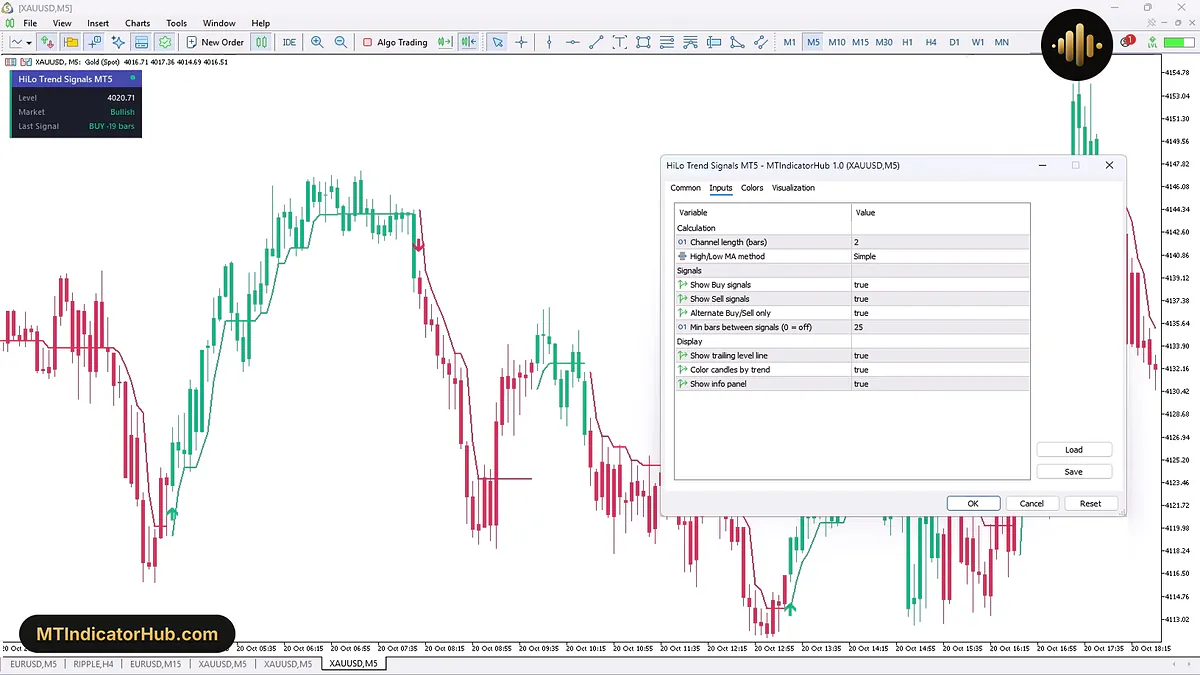
Only the two Calculation inputs move the level line and decide where the trend flips; the four Signals inputs choose which of those flips get an arrow, and the three Display inputs switch the drawings on or off. Min bars between signals (0 = off) carries its own hint: set to 0, it stops spacing the arrows.
| Input | Default | What it changes |
|---|---|---|
| Calculation: how the level line and the trend are worked out | ||
| Channel length (bars) | 2 | Number of recent candles whose highs and lows are averaged |
| High/Low MA method | Simple | Type of moving average used for those highs and lows |
| Signals: which trend flips get an arrow | ||
| Show Buy signals | true | Draws or hides the Buy Arrows |
| Show Sell signals | true | Draws or hides the Sell Arrows |
| Alternate Buy/Sell only | true | Makes arrows take turns, so a Sell follows a Buy and a Buy follows a Sell |
| Min bars between signals (0 = off) | 25 | Fewest candles between two arrows; 0 removes the gap |
| Display: what is drawn on the chart | ||
| Show trailing level line | true | Shows or hides the green and red level line |
| Color candles by trend | true | Paints the candles green or red by trend |
| Show info panel | true | Shows or hides the panel with Level, Market and Last Signal |
Channel length (bars) and Min bars between signals count candles, not minutes. On M5, a Channel length of 2 spans 10 minutes and the 25-candle gap equals 2 hours 5 minutes between arrows; on M15 that gap grows to 6 hours 15 minutes, and on H1 to 25 hours.
Conclusion
The HiLo Trend MT5 indicator answers one question on every closed candle: are the recent highs and lows carrying price up or down? It shows the answer three ways at once, in the level line, the candle colours and the info panel, and puts an arrow on the candle where the answer changes.
Since the trend is judged only after a candle closes, every arrow trails the real turning point by at least that candle. The level line is a guide rather than a trigger: price can close on the wrong side of it for a few candles without the trend changing. Not every turn gets an arrow either, since Min bars between signals and Alternate Buy/Sell only skip the ones that come too soon or repeat the last side, while the colours and the line still show them. There is no alert input either; a fresh arrow is only noticed by checking the chart.
Your rating
Rate this indicator
How useful was this indicator? Click a star.
FAQ
Frequently asked questions
It is the trailing level the indicator builds from the averages of recent highs and lows. A green line under the candles means the trend is up, a red line over them means it is down, and its latest value appears as Level in the info panel. While green it can serve as support, and while red as resistance.
The colours and the level line follow every change of trend, but an arrow has to pass two filters. With the defaults, the previous arrow has to be at least 25 candles back, and it has to point the other way. A bullish turn that comes 20 candles after a Sell, or a second bearish turn after a Sell, therefore stays unmarked.
It sets how many recent candles feed the averages of highs and lows, 2 by default. Raising it averages more candles, so the level line moves more smoothly and reacts more slowly to fresh highs and lows. High/Low MA method picks the type of average, Simple by default.
No. With Color candles by trend on, a candle carries the colour of the current trend, not of its own open and close. A candle that closes lower stays green while the trend is still up, and the colour switches only on the candle that flips the trend.
It is the Last Signal row: the side of the most recent arrow and the number of candles since it, counted to the newest candle on the chart. When the chart is scrolled into the past, that arrow can sit beyond the right edge of the candles on screen, so the panel and the arrows in view may describe different moments.






Comments
Be the first to comment.