


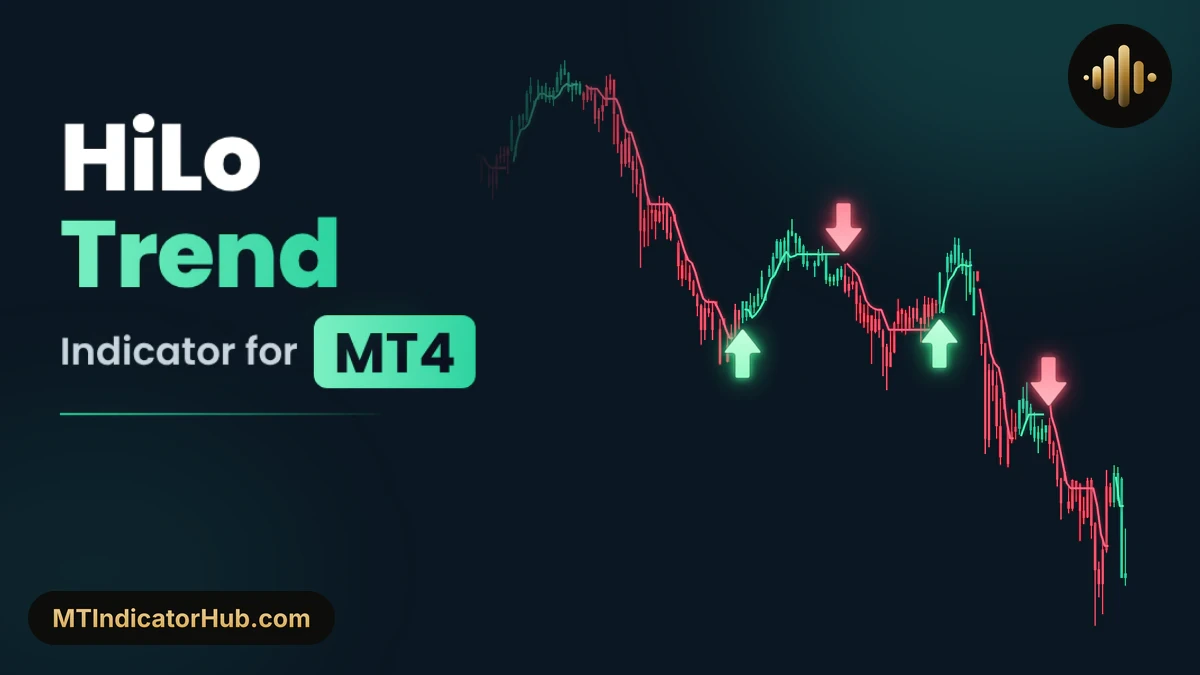
On MetaTrader 4, the HiLo Trend indicator reads where the market's latest highs and lows are heading and turns that into one trailing line: below the candles and green when buyers lead, above them and red when sellers do. The candles take the same colour, and the closed candle where the trend changes side gets an arrow, Buy under it or Sell over it.
Draws one green or red trailing line from the latest highs and lows on MT4, paints the candles by trend and marks each new trend with a Buy or Sell arrow.
HiLo Trend Specifications
The MT4 build keeps the line, the coloured candles, the arrows and the panel together on the main chart and decides each arrow only once its candle is complete.
| Item | Details |
|---|---|
| Platform | MetaTrader 4 (MT4); also available for MT5 |
| Categories | Support & Resistance, Signal & Forecast |
| Indicator type | Trend, Reversal, Entry Exit |
| Skill level | Beginner |
| Timeframes | Any; shown here on M5 and M15 |
| Trading style | Scalper, Intraday |
| Markets | Forex, Commodities, Indices, Crypto, Stock (shown on XAUUSD) |
| Display | Trailing level line in green or red, candles painted in the trend colour, Buy and Sell arrows, plus a panel listing Level, Market and Last Signal; everything sits on the main chart |
| Alerts | None |
| Version | 1.0 |
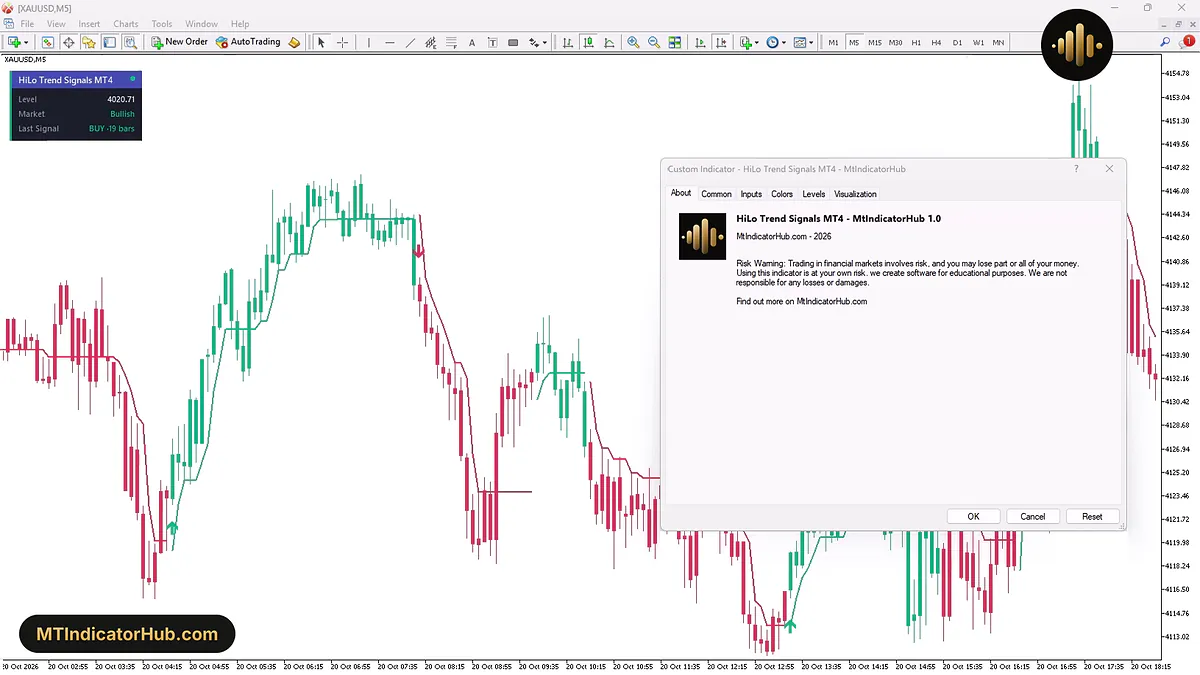
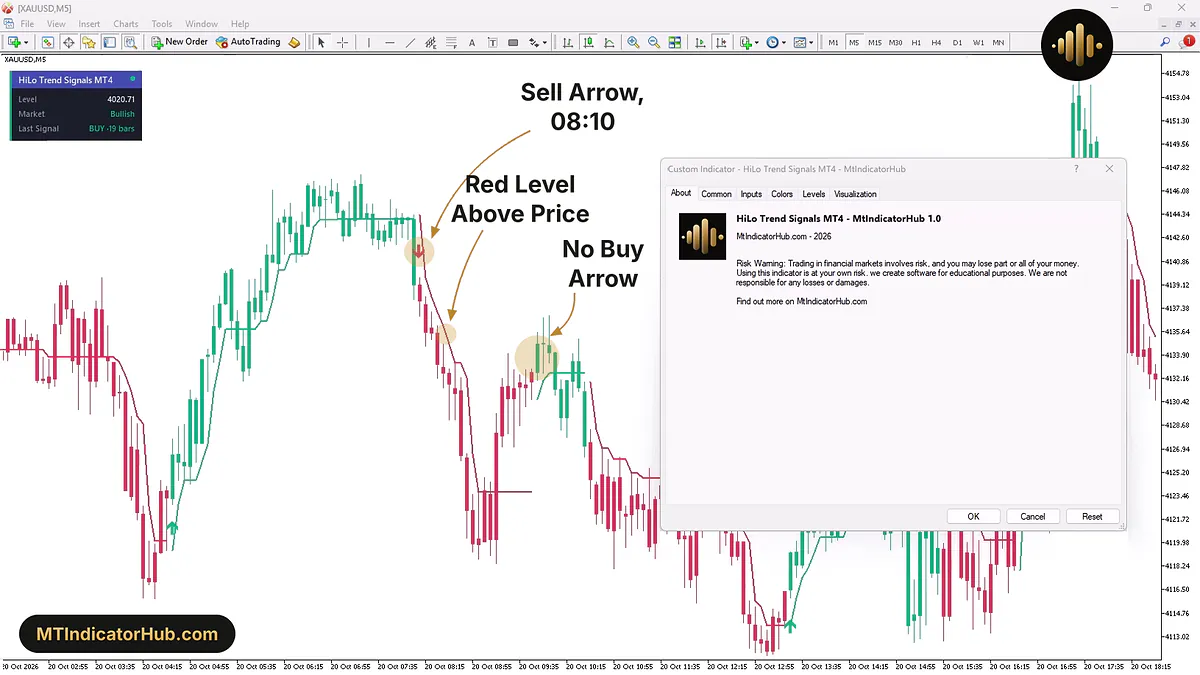
With the About tab open on top, the panel at the chart's upper left shows Level 4020.71, Market at Bullish and BUY ·19 bars as Last Signal, and the XAUUSD,M5 candles beside the dialog alternate between red and green runs.
What Is the HiLo Trend Indicator?
Built for MetaTrader 4, the HiLo Trend indicator works from two averages, one of the recent highs and one of the recent lows. Channel length (bars) sets how many candles go into them, 2 unless changed, and High/Low MA method chooses how they are averaged, with Simple as the default. Whichever side those averages favour becomes the trend, and the indicator shows it in three places.
The first is the trailing level line. In a bullish phase it is green and stays under price, rising in steps and resting flat in between; in a bearish phase it is red, stays over price and steps down. That behaviour makes it a ready-made support and resistance line: support while green, resistance while red.
The second is the candles themselves. Color candles by trend paints them in the trend's colour, so a down candle inside an uptrend is still drawn green.
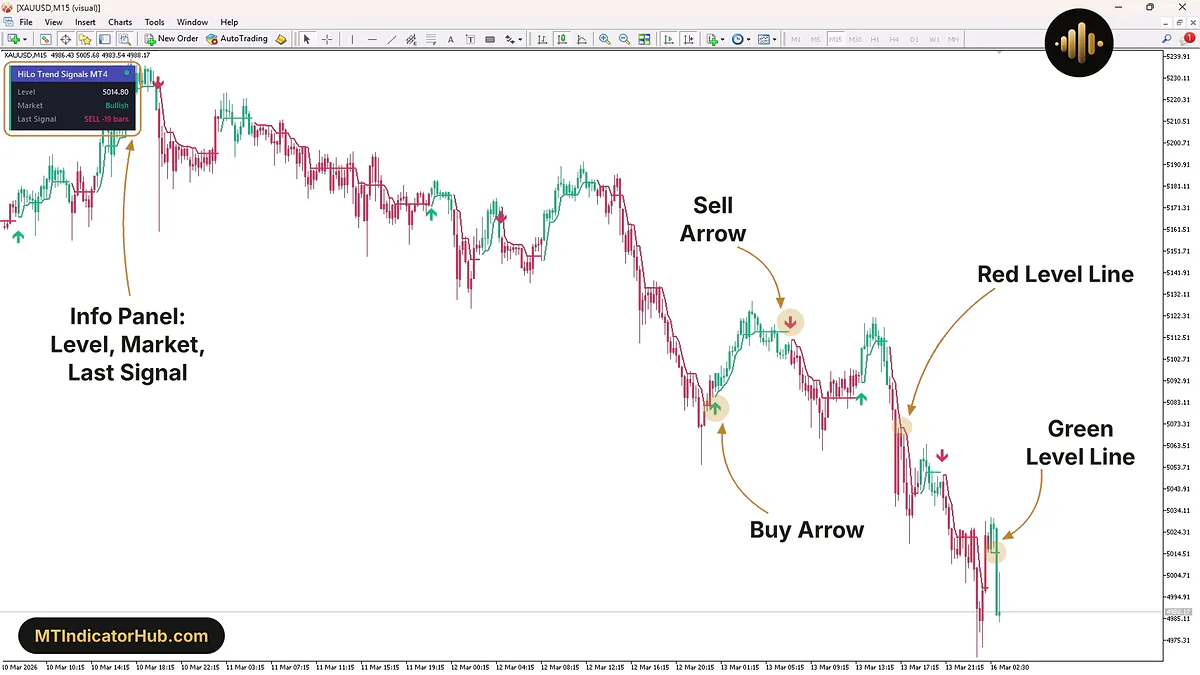
The third is a small panel at the chart's top left, titled HiLo Trend Signals MT4. Its Level row gives the line's current value, Market names the trend as Bullish, Bearish or Neutral; Last Signal states the side of the newest arrow and counts the bars since it. A green or red stripe on its left side and a dot beside the title match the trend.
Over 10 to 16 March 2026 on an XAUUSD M15 tester chart, only eight of the line's many colour switches carry an arrow, and the run ends with Market Bullish next to SELL ·19 bars, since a new arrow needs 25 bars after that Sell.
Buy Signal
On MT4 a Buy Arrow appears under the first closed candle of a new uptrend: the candle turns green, the red line that was hanging over price ends, and a green line starts underneath.
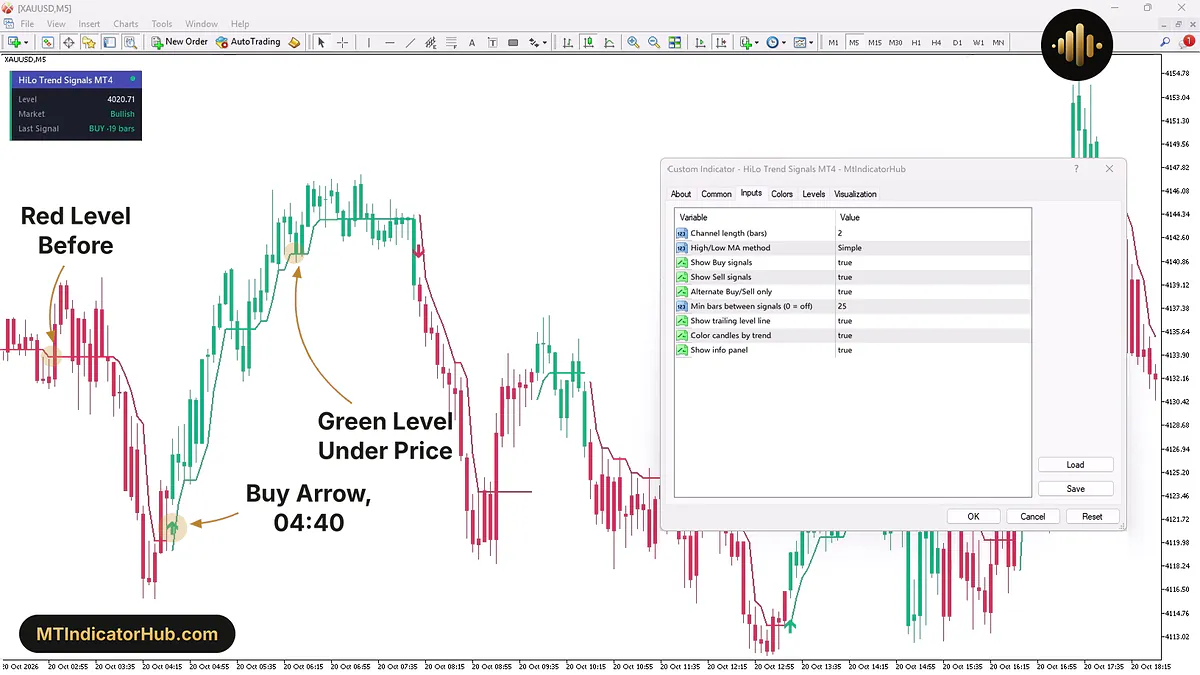
XAUUSD,M5 on 20 October 2026 shows it clearly. The red line had come down from about 4133.79 before 03:30 to about 4120.15 at 04:25, the bar that dipped to 4115.84. Fifteen minutes later the 04:40 candle opened at 4123.26, touched 4127.66 and finished at 4126.50, painted green, with the Buy Arrow placed just under its 4122.81 low.
The uptrend then held for 42 bars. Its green line rose from step to step, resting near 4135.85 for the five bars from 05:25 and around 4144.02 through the 07:00 to 08:00 hour, while price pushed to 4146.83 on the 07:15 bar, 20.33 over the arrow candle's close.
A long position based on this arrow would use the 4126.50 close to enter and the 4122.81 low, 3.69 away, for the first stop; later the stop can be raised to each new green step as the line climbs.
Sell Signal
Sell Arrows work the other way round: the first candle that closes in a new downtrend turns red, the green support beneath price stops, and its arrow is placed over that candle.
Before the 08:10 sell on the same chart, the green line had sat flat near 4144.02 for an hour while candles closed below it, at 4142.34 on the 07:40 bar for example, and the trend did not change. Even the 08:05 bar, which fell from 4143.95 to 4139.11, kept its green colour. The 08:10 bar, open 4139.12 and close 4137.90, was the one that turned red, so the Sell Arrow went above it and a red line took over above price.
The decline carried price to 4118.74 by 09:00, 19.16 below the 08:10 close, and the red line came down behind it to about 4123.78. A first stop for a short sits just over the arrow candle's 4139.64 high, 1.74 above the close.
Two later turns on this chart show why the line and the arrows do not always agree. At 09:50, 20 bars on from the Sell, buyers took over again with green candles and a green line, yet with a Min bars between signals value of 25 no Buy Arrow could appear. At 10:35, 29 bars from the Sell, the chart turned bearish once more; the gap was long enough this time, but Alternate Buy/Sell only, left at true, does not allow two Sells in a row.
Indicator Settings
In MetaTrader 4 the nine inputs appear as a single list, without the Calculation, Signals and Display headers of the MT5 build.
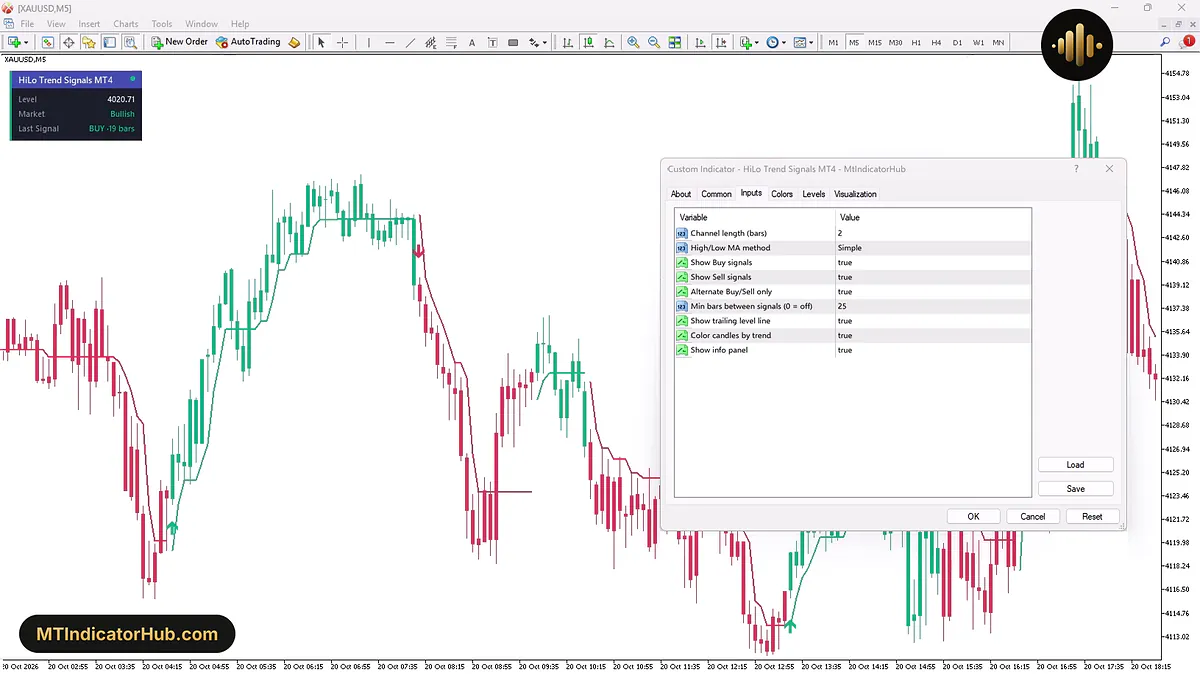
The first two inputs set how the trend is measured, the next four only filter the arrows, and the last three switch the drawings: line, candle colours, panel. Setting Min bars between signals (0 = off) to 0 switches the spacing off.
| Input | Default | What it changes |
|---|---|---|
| Channel length (bars) | 2 | How many recent candles are averaged for the highs and for the lows |
| High/Low MA method | Simple | Kind of moving average applied to those highs and lows |
| Show Buy signals | true | Turns the Buy Arrows on or off |
| Show Sell signals | true | Turns the Sell Arrows on or off |
| Alternate Buy/Sell only | true | Allows a Buy only after a Sell and a Sell only after a Buy |
| Min bars between signals (0 = off) | 25 | Smallest distance in bars between two arrows; 0 switches it off |
| Show trailing level line | true | Turns the green and red line on or off |
| Color candles by trend | true | Turns the trend colouring of the candles on or off |
| Show info panel | true | Turns the Level, Market and Last Signal panel on or off |
Counted in bars, the 25-bar spacing comes to 2 hours 5 minutes on M5, 6 hours 15 minutes on M15 and 100 hours on H4, and on M15 the default Channel length reaches back 30 minutes.
Conclusion
On MT4, the HiLo Trend indicator turns the latest highs and lows into a single verdict per closed bar, bullish or bearish, and shows it as a line, a candle colour and a panel row, with an arrow on the bar where the verdict changes.
That verdict only exists once the bar has closed, so every arrow comes at least one bar after the true turn. Closes slightly beyond the line do not reverse the trend by themselves, which makes the line a trend marker rather than an exact exit price. The arrow filters also hide some changes: a turn within 25 bars of the last arrow, or a second turn to the side of the last arrow, keeps its colour change but is left without an arrow. No alert of any kind exists among the inputs, so the chart has to be watched for new arrows.
Your rating
Rate this indicator
How useful was this indicator? Click a star.
FAQ
Frequently asked questions
Yes. While the trend is bullish the line runs under the candles and acts as a support level that rises in steps; while it is bearish the line runs over them as resistance. Price can close a little beyond it without flipping the trend, so it works best as a zone to watch, not a hard trigger.
No. The trend is judged from finished bars only. While a candle is still forming the indicator does not mark it, and once it closes on the other side of the trend the arrow is fixed on that bar. The cost is that part of the new move has already happened when the arrow shows.
With the default true, the arrows must alternate: after a Buy Arrow the next one can only be a Sell, and after a Sell only a Buy. If the trend turns bearish twice without a Buy Arrow in between, the second turn is drawn in red candles and a red line but gets no Sell Arrow.
It shows one of three states, Bullish, Bearish or Neutral, matching the line's colour. Because arrows are filtered, the row can already read Bullish while Last Signal still reports a Sell, as at the end of the March 2026 Strategy Tester run.






Comments
Be the first to comment.