


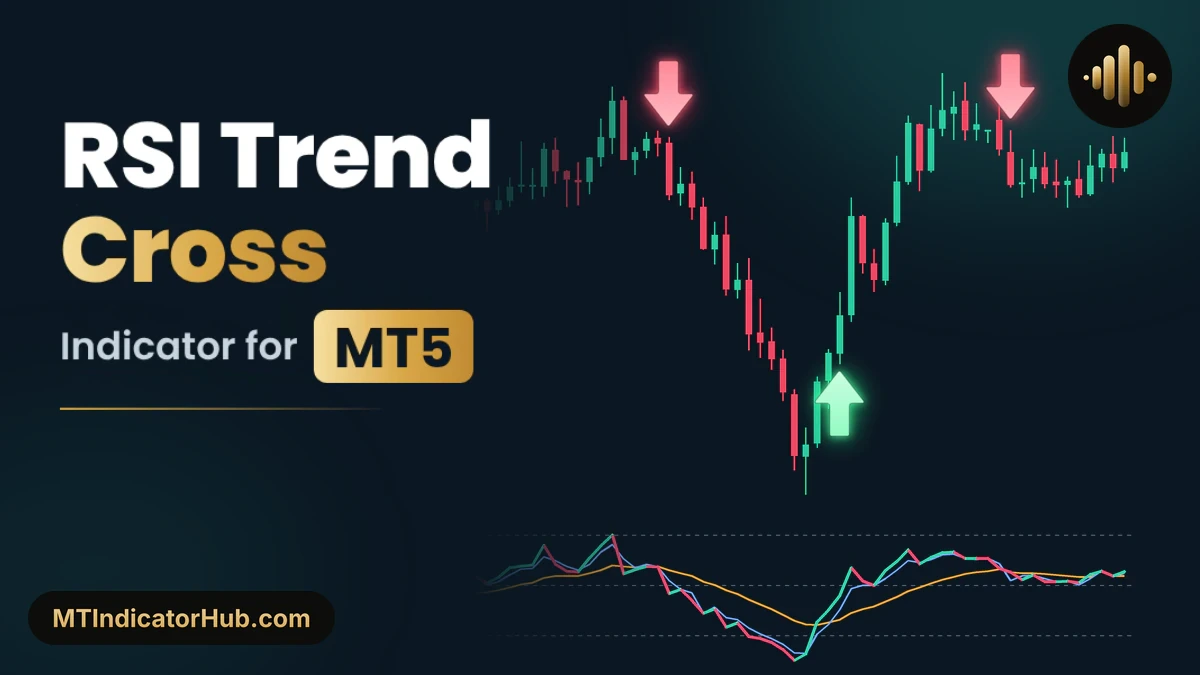
The RSI Trend Cross MT5 indicator plots the RSI together with two signal lines, a fast one and a slow one, in its own window under the price chart. When the fast line rises through the slow line while the slow line is still under the 50 midline, a Buy Arrow appears below the candle; when it falls through the slow line above 50, a Sell Arrow appears above it.
Plots RSI 14 with a fast and a slow signal line and marks the closed candle where they cross: a Buy Arrow under 50, a Sell Arrow above it.
RSI Trend Cross Specifications
RSI Trend Cross Signals MT5 draws its three lines in a separate window with dotted 70, 50 and 30 levels, and prints each arrow only once its candle has closed.
| Item | Details |
|---|---|
| Platform | MetaTrader 5 (MT5); also available for MT4 |
| Categories | Oscillators, Signal & Forecast |
| Indicator type | Trend, Overbought & Oversold, Entry Exit |
| Skill level | Intermediate |
| Timeframes | Any; shown here on M5 and M15 |
| Trading style | Scalper, Intraday |
| Markets | Forex, Commodities, Indices, Crypto, Stock (shown on XAUUSD) |
| Display | RSI line in turquoise and red with a blue fast line and an orange slow line, dotted 70, 50 and 30 levels, all in their own window; Buy and Sell arrows on the candles; a panel listing RSI, Market and Signal |
| Alerts | Optional alert on each new arrow (Alert on new signal, off by default) |
| Version | 1.0 |
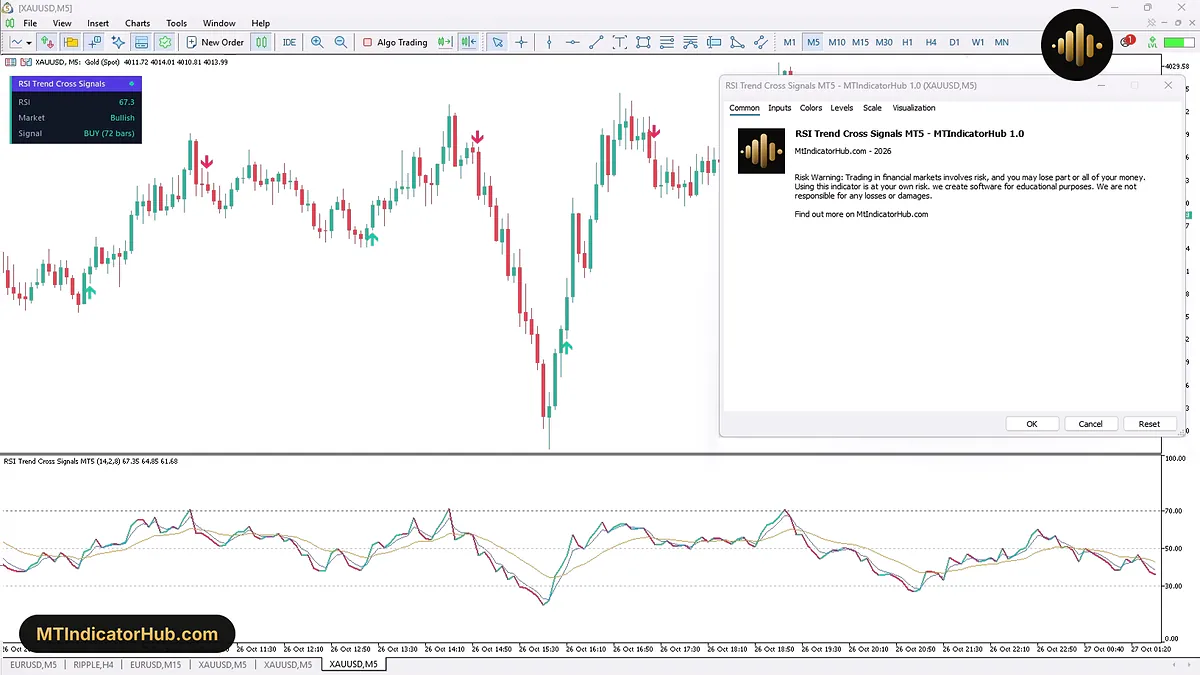
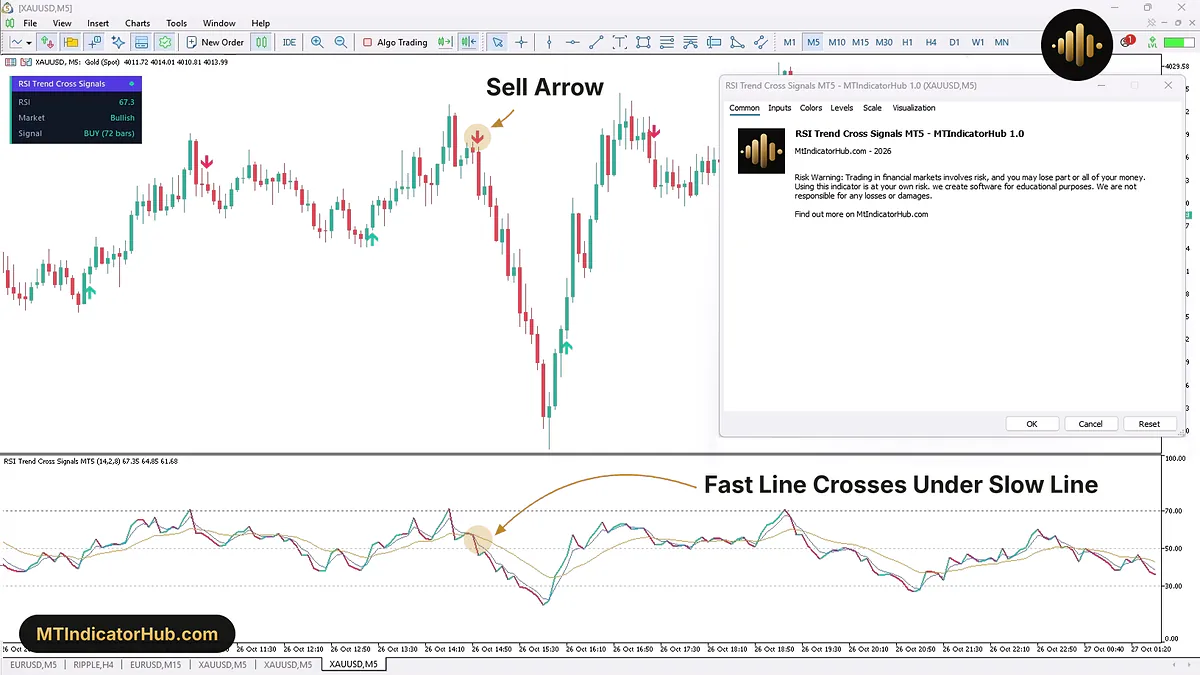
With the Common tab open, the info panel in the chart's top left corner on XAUUSD M5 reads RSI 67.3, Market Bullish and Signal BUY (72 bars). The indicator window label, RSI Trend Cross Signals MT5 (14,2,8), carries the RSI, fast and slow values 67.35, 64.85 and 61.68.
What Is the RSI Trend Cross Indicator?
The RSI Trend Cross indicator is an RSI crossover indicator for MetaTrader 5. Its main line is the relative strength index of the last 14 closes, which moves between 0 and 100 as buying and selling momentum shifts. Two signal lines follow that RSI line: the fast line, set to 2 periods, turns with it almost at once, while the slow line, set to 8 periods, bends more slowly. With the fast line above the slow line, the RSI is gaining against its own recent average; below it, the RSI is losing ground.
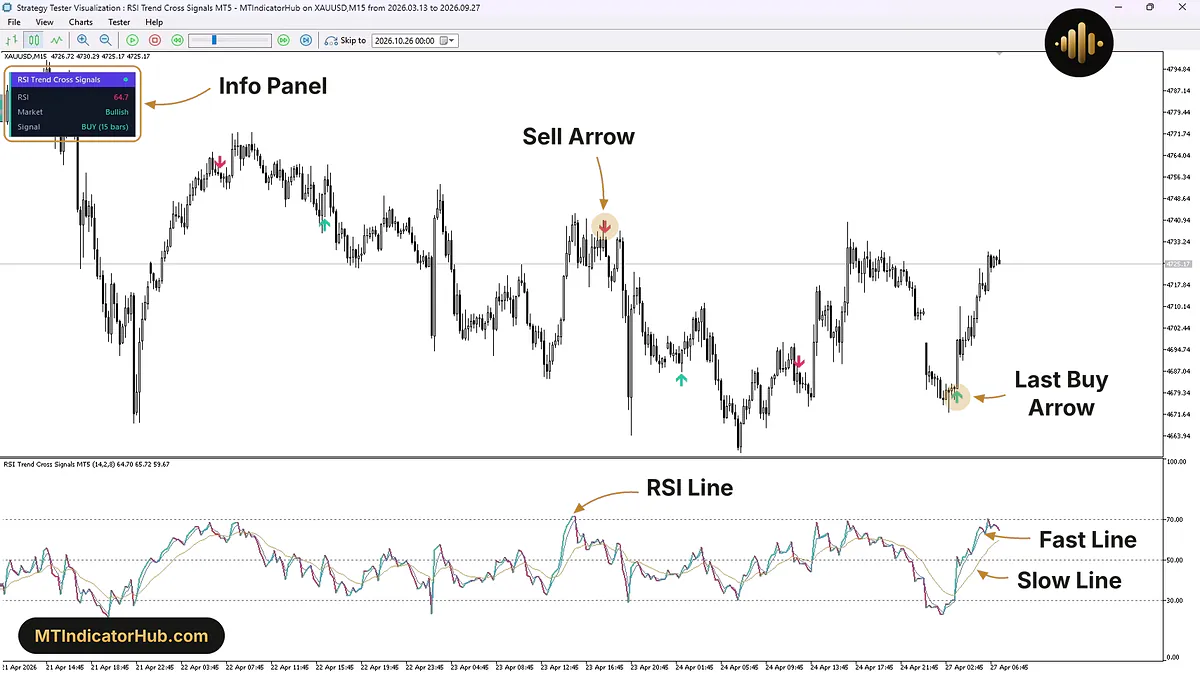
The RSI line is the thicker one in the window, and its colour follows its direction: turquoise while it rises, red while it falls. The fast line is blue and the slow line orange. Three dotted levels cross the window: the Overbought level at 70, the midline at 50 and the Oversold level at 30.
The info panel, headed RSI Trend Cross Signals, has three rows. RSI shows the current reading. Market says Bullish while the fast line is over the slow line, Bearish while it is under, and Neutral when the two are level; when the RSI is above 70 or below 30 it adds OB or OS. Signal gives the direction of the most recent arrow and the count of candles closed after it, as in BUY (72 bars). The Data Window lists the three lines as RTCS RSI, RTCS Fast and RTCS Slow under Indicator window 1.
At the end of the 21 to 27 April 2026 stretch on XAUUSD M15, Signal reads BUY (15 bars): the last Buy Arrow, 15 candles back.
Buy Signal
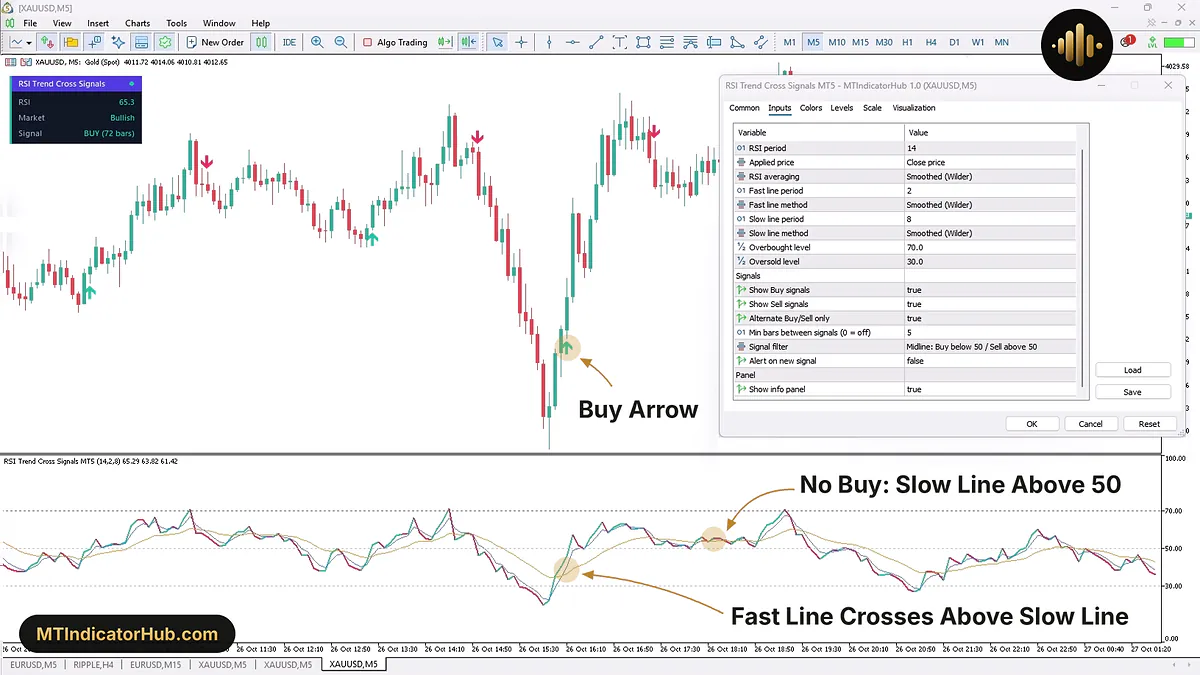
A Buy Arrow marks the candle on which the blue fast line closes above the orange slow line. With the default Signal filter, Midline: Buy below 50 / Sell above 50, that crossing counts only while the slow line is under 50, so the arrow comes out of a weak stretch of RSI that is starting to recover. The arrow sits under the candle's low.
On XAUUSD M5 on 26 October 2026, the RSI sank to 20.17 at 15:50 and turned up from there: 35.48 at 16:00, 40.29 at 16:05 and 45.95 at 16:10, its line turquoise all the way. At 16:05 the fast line, about 34.5, was still a little under the slow line, about 35.3. On the 16:10 candle it rose to about 40.4 and passed the slow line near 36.4, far below 50, and the Buy Arrow printed under that candle, which opened at 4001.44, dipped to 4000.50 and closed at 4004.90.
The previous arrow was the Sell Arrow of 14:55, 15 candles earlier, so Alternate Buy/Sell only and Min bars between signals, at 5 candles, had nothing to block.
Price kept rising after the arrow and reached about 4026.72 by 16:55, about 21.82 above the arrow candle's close. As a long trade idea, a stop under the arrow candle's low at 4000.50 risks 4.40 from its close, and the 15:55 low at 3988.73 offers a wider one. The opposite crossing is the exit the tool itself offers: the next Sell Arrow came at 17:25, 15 candles after this buy.
What the midline filter holds back appears at 18:15 on the same chart. At 18:15 the fast line, about 54.9, was again above the slow line, about 53.8, yet no Buy Arrow appeared under the candle: the slow line was over 50, where Midline only allows sells. With Signal filter set to No filter (every cross), the side of 50 no longer matters.
Sell Signal
Sell Arrows come from the opposite crossing, the blue fast line dropping under the orange slow line, and the midline filter now wants the slow line above 50, in the upper half of the RSI scale. The arrow is placed above the high of that candle.
The sell before that buy formed on the same XAUUSD M5 chart at 14:55 on 26 October 2026. A rally had pushed the RSI to the 70 line at 14:30, where price peaked near 4025.51, and by 14:50 the reading had eased to 57.33. The 14:55 candle then opened at 4020.41 and closed at 4015.83, and the RSI dropped to 46.24, 11.09 lower in one candle, its line turning red. That single drop pulled the fast line down to about 51.9, under the slow line at about 56.0, and with the slow line still above 50 the Sell Arrow appeared over the candle's high of 4020.96.
It was the first sell after the 13:25 Buy Arrow, 18 candles back. The fall went on for an hour: the RSI reached 20.17 at 15:50, under the Oversold level, and price touched 3988.73 at 15:55, 27.10 below the arrow candle's close.
A short taken on this arrow could keep its stop over the candle's high at 4020.96, 5.13 above the close, or over the 14:30 peak near 4025.51, about 9.68 away. The position can be held until the fast line crosses back above the slow line under 50, which on this chart was the 16:10 Buy Arrow.
Indicator Settings
Sixteen inputs sit in this tab, sorted into the RSI, Signals and Panel groups.
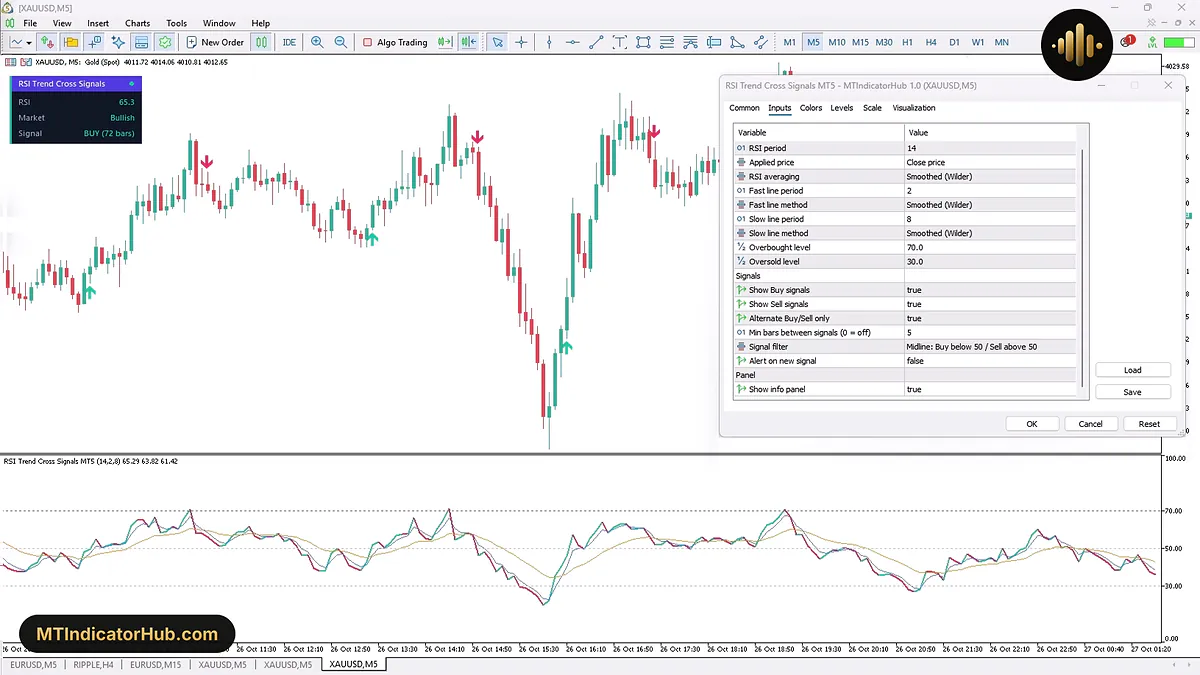
RSI averaging, Fast line method and Slow line method all start at Smoothed (Wilder), the averaging of the original RSI, and RSI averaging offers four modes in its list. Three choices sit in the Signal filter list: No filter (every cross), Midline: Buy below 50 / Sell above 50 and Extreme: RSI recently touched OB/OS.
| Input | Default | What it changes |
|---|---|---|
| RSI: the RSI line, its two signal lines and the outer levels | ||
| RSI period | 14 | Candles counted by the RSI |
| Applied price | Close price | Which price of each candle feeds the RSI |
| RSI averaging | Smoothed (Wilder) | Averaging used inside the RSI line itself |
| Fast line period | 2 | Length of the blue fast line |
| Fast line method | Smoothed (Wilder) | Averaging type of the fast line |
| Slow line period | 8 | Length of the orange slow line |
| Slow line method | Smoothed (Wilder) | Averaging type of the slow line |
| Overbought level | 70.0 | Upper dotted line; above it the panel's Market row adds OB |
| Oversold level | 30.0 | Lower dotted line; below it the Market row adds OS |
| Signals: which crossings get an arrow | ||
| Show Buy signals | true | Puts arrows under the candles, or leaves them out |
| Show Sell signals | true | Puts arrows over the candles, or leaves them out |
| Alternate Buy/Sell only | true | Forces Buy and Sell arrows to alternate |
| Min bars between signals (0 = off) | 5 | Fewest candles between two arrows; 0 removes the gap |
| Signal filter | Midline: Buy below 50 / Sell above 50 | Which crossings earn an arrow: all of them, only those on the right side of 50, or only those after a recent touch of 30 or 70 |
| Alert on new signal | false | Sends an alert when a new arrow appears |
| Panel: the on-chart readout | ||
| Show info panel | true | Displays the RSI, Market and Signal box when true |
All counts are in candles. On the M5 chart above, the 14-candle RSI covers 70 minutes, the 8-candle slow line 40 minutes and the 5-candle gap 25 minutes; on M15, as in the tester view, the same 8 and 5 candles last 2 hours and 1 hour 15 minutes.
Conclusion
The RSI Trend Cross MT5 indicator does one job: it watches a fast and a slow signal line drawn from the RSI and marks the closed candle where they cross, as a Buy under the midline or a Sell above it.
Because both signal lines follow the RSI, a crossing lags the turn it reports, and an arrow can only appear after its candle closes, so the first leg of that turn is behind it. When the RSI hovers around 50, the two lines can cross back and forth within a few candles; the midline filter drops the crossings on the wrong side of 50, and with Alternate Buy/Sell only, a crossing earns an arrow only when the previous arrow pointed the other way. Alert on new signal starts at false; until it is switched on, the only notice of a new signal is the arrow itself. The panel's Signal row counts candles from the newest bar, and after the chart is dragged into the past it may refer to an arrow beyond the right edge of the screen.
Your rating
Rate this indicator
How useful was this indicator? Click a star.
FAQ
Frequently asked questions
They show the direction of the RSI line itself, not a signal. A segment is turquoise on a candle where the RSI rose and red where it fell. Arrows come only from the fast and slow lines, which keep their fixed blue and orange colours.
Three settings can hold one back. The default Signal filter accepts a bullish crossing only while the slow line is under 50 and a bearish one only while it is over 50; Alternate Buy/Sell only, left at its default of true, makes each arrow point the opposite way from the one before it; and Min bars between signals sets a floor of 5 candles between two arrows. A crossing that fails any of these leaves no mark on the candles.
Extreme: RSI recently touched OB/OS ties each arrow to a recent visit of the outer levels. A Buy Arrow then needs the RSI to have reached the Oversold level, 30 by default, within the last few candles, and a Sell Arrow needs a recent touch of the Overbought level, 70. No filter (every cross) is the loosest of the three choices.
It is the Signal row: the latest arrow was a Buy, printed 72 candles before the newest candle. The count starts at the live bar, so when older candles fill the screen, the arrow it names may lie off to the right. In the tester recording the same row read BUY (15 bars) for the Buy Arrow 15 candles left of the last bar.






Comments
Be the first to comment.