


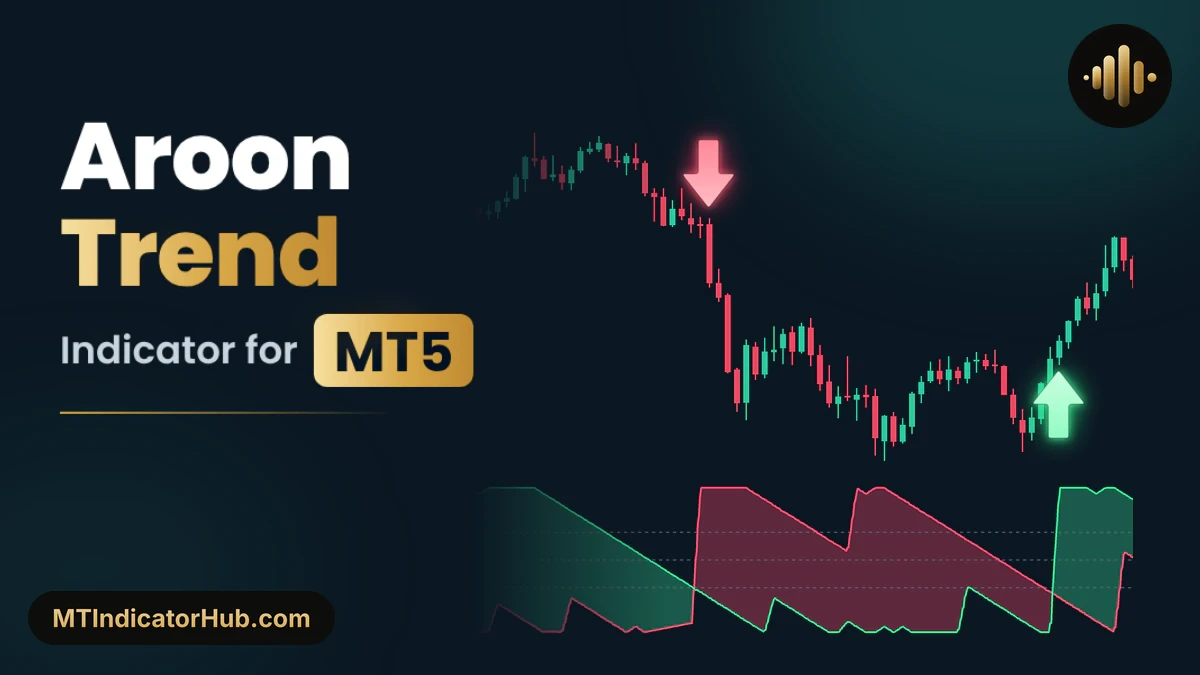
The Aroon Trend MT5 indicator tracks how fresh the latest 25-candle high and low are and draws them as two lines from 0 to 100 in a window under the chart. When Aroon Up reaches the Strong-trend level of 70 while Aroon Down sits at 30 or lower, a Buy Arrow prints under the closed candle; with the roles reversed, a Sell Arrow appears above it. A trend filter, a momentum check and an alternation rule then thin the arrows out.
Draws Aroon Up and Aroon Down from 0 to 100 and prints a Buy or Sell Arrow when one line reaches 70 while the other stays at 30 or lower.
Aroon Trend Specifications
Aroon Trend Signals MT5 draws Aroon Up and Aroon Down in their own window below the price and places every arrow only after its candle closes.
| Item | Details |
|---|---|
| Platform | MetaTrader 5 (MT5); also available for MT4 |
| Categories | Oscillators, Signal & Forecast |
| Indicator type | Trend, Breakout, Entry Exit |
| Skill level | Intermediate |
| Timeframes | Any, Multi Timeframe; shown here on M5 and M15 |
| Trading style | Scalper, Intraday, Day Trading |
| Markets | Forex, Commodities, Indices, Crypto, Stock (shown on XAUUSD) |
| Display | Aroon Up and Aroon Down from 0 to 100 with a green or pink cloud and 70, 50 and 30 levels in a separate window; Buy and Sell Arrows on the price chart; info panel with Up / Down, Market and Signal |
| Alerts | None |
| Version | 1.0 |
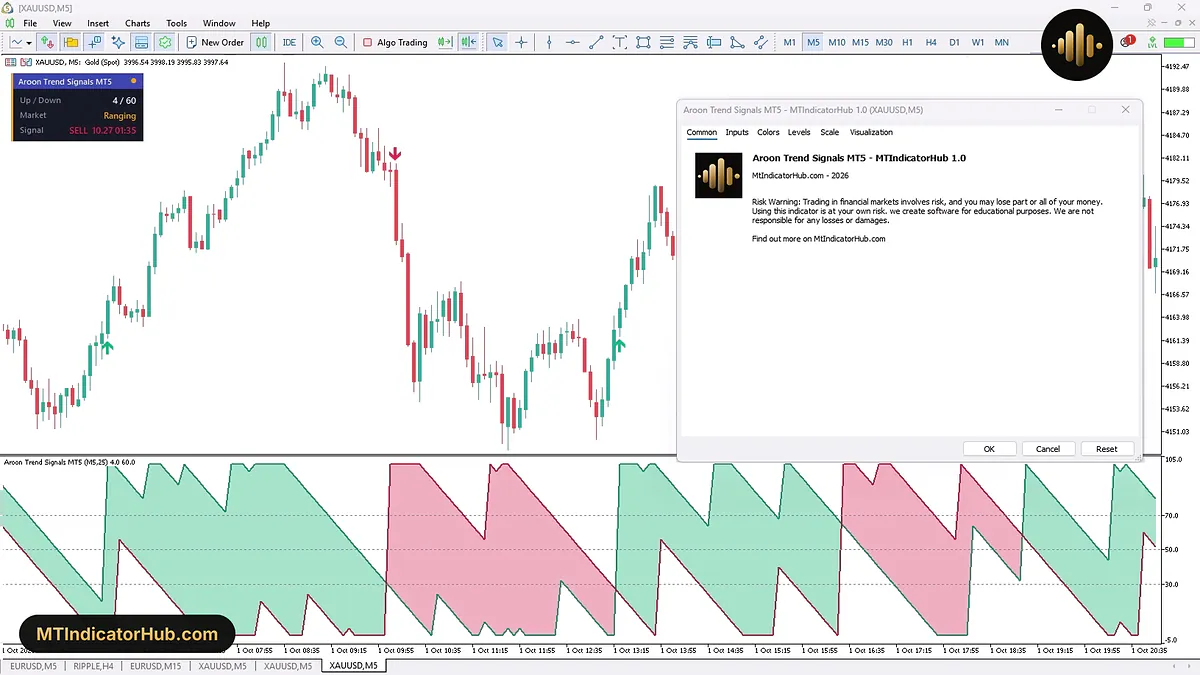
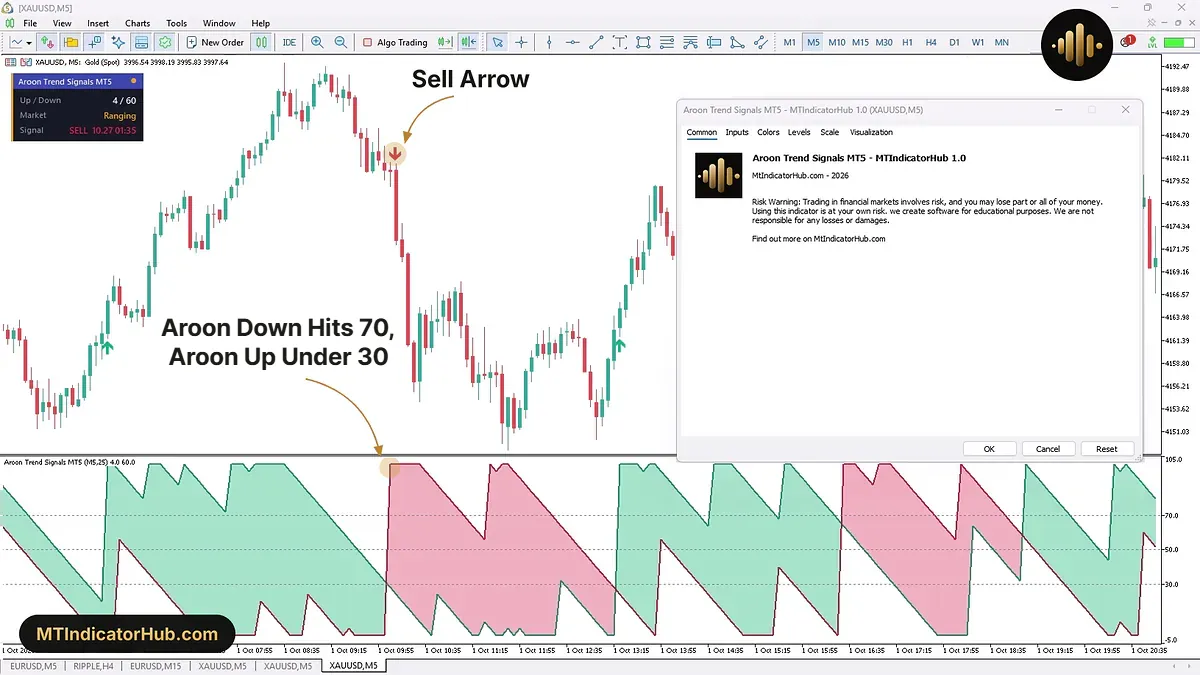
In the Common tab image, the info panel at the top left reads Up / Down 4 / 60 and Market Ranging in orange, because the leading line has not reached 70 on the newest candle. Under the candles, the Aroon window switches between green and pink clouds as the two lines trade places.
What Is the Aroon Trend Indicator?
The Aroon Trend indicator is a trend tool for MetaTrader 5 built on Aroon Up and Aroon Down, with buy and sell arrows, filters and a status panel on top. It does not measure how far price travels; it measures time. Aroon Up shows how long ago the highest high of the last 25 candles, the Aroon period, was made: a brand-new high puts the line at 100, and the line slides lower step by step as that high grows older, down to 0 once it is 25 candles old. Aroon Down tells the same story for the lowest low.
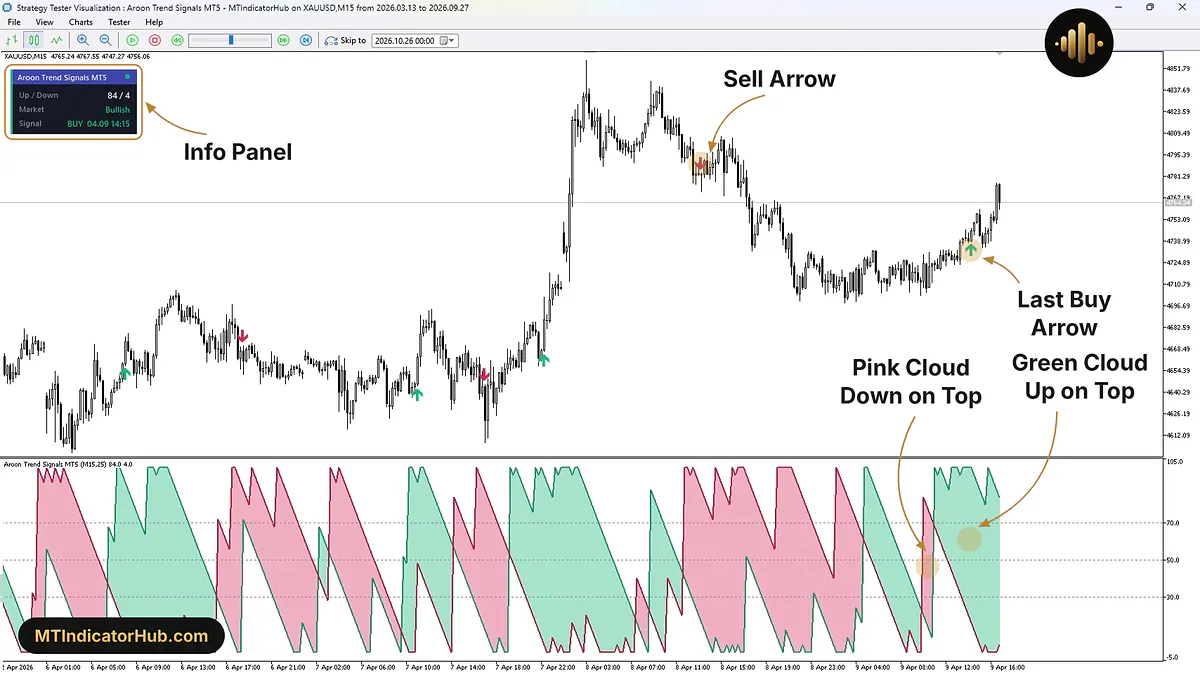
The green line is Aroon Up and the crimson line is Aroon Down. The space between them is filled as a cloud, green while Aroon Up leads and pink while Aroon Down is on top. Three dotted levels cross the window: 70, the Strong-trend level; 50, the middle; and 30, the mirror of 70 that the opposite line has to stay under. The window label repeats the setup and both current readings, for example Aroon Trend Signals MT5 (M15,25) 84.0 4.0, and the Data Window lists them as Aroon Up and Aroon Down under Indicator window 1. Holding the mouse over an arrow shows the two values of that candle.
The info panel, titled Aroon Trend Signals MT5, has three rows. Up / Down gives both readings of the newest candle. Market reads Bullish when Aroon Up is the higher line and has reached the Strong-trend level, Bearish when Aroon Down has done the same, and Ranging in every other case. Signal names the latest arrow with its date and time. A colour strip along the panel's left edge and a dot in its title bar follow the Market row in green, red or orange.
Over a Strategy Tester session on XAUUSD M15 from 6 to 9 April 2026, seven arrows take turns, and BUY 04.09 14:15 in the panel marks the last of them.
Buy Signal
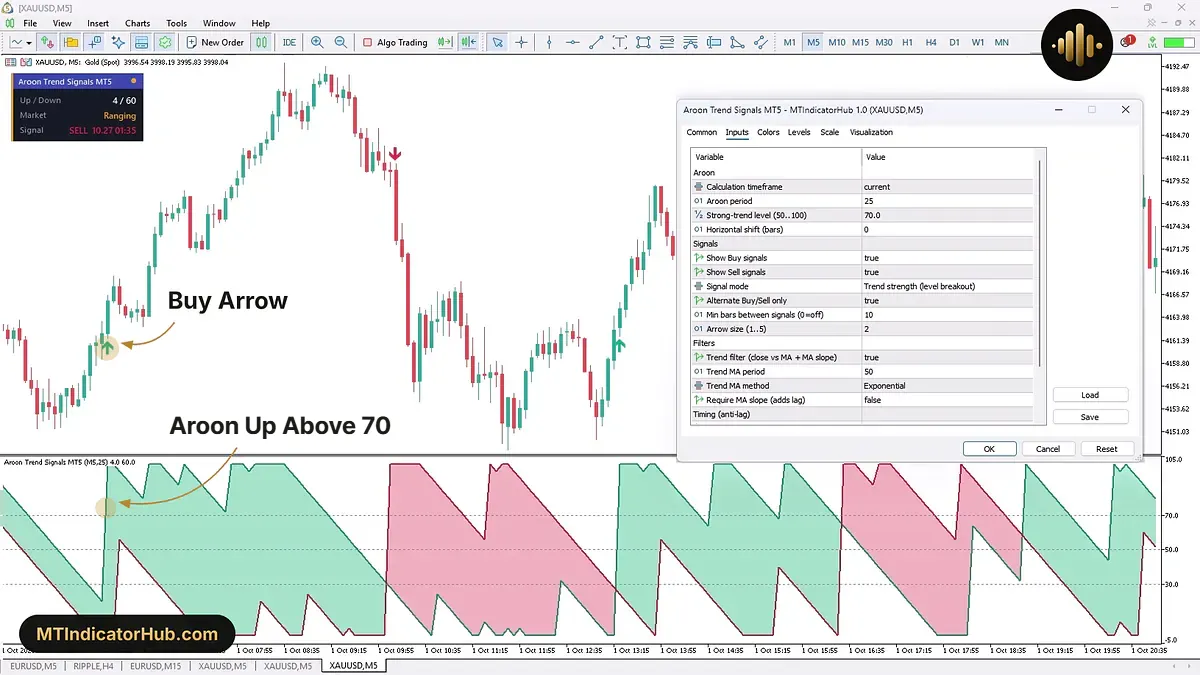
In the default Signal mode, Trend strength (level breakout), a Buy Arrow goes to the candle on which Aroon Up has reached 70 while Aroon Down is at 30 or lower. The arrow sits under that candle and appears once the candle closes.
On XAUUSD M5 on 1 October 2026, Aroon Up read 20 on the 06:00 candle, with Aroon Down at 0. The 06:05 candle then made a fresh 25-candle high: Aroon Up jumped to 100 while Aroon Down stayed at 0. That candle opened at 4162.14, closed at 4165.90, and the Buy Arrow was drawn beneath it.
Two filters check the candle as well. The trend filter wants the close above the 50-period exponential moving average, and the momentum check wants a close higher than the one before it, with Aroon Up not falling. Here the 06:05 close stood 3.78 above the 06:00 close of 4162.12, and Aroon Up was rising from 20.
The uptrend that followed kept the buy setup alive for a long time. On every candle from 06:50 to 09:10, Aroon Up stood between 72 and 100 and Aroon Down at 28 or lower, yet no second Buy Arrow appeared. With Alternate Buy/Sell only set to true, the arrow after a Buy has to be a Sell, so one wave, one arrow.
As a long trade idea, the arrow candle supplies the levels: an entry at the 06:10 open of 4165.90 and a stop under the 06:05 low of 4161.56, 4.34 lower. The 09:10 candle reached a high of 4192.46, 26.56 above that entry. A pink cloud or the next Sell Arrow tells the trader that the buy side has lost its lead.
Sell Signal
For a Sell Arrow the roles swap: Aroon Down has to reach 70 and Aroon Up has to be at 30 or below, and the arrow is drawn above the closed candle. In the trend filter, the close now has to be under the moving average.
Later on 1 October, the same M5 chart shows the turn. At 10:00 Aroon Up read 32 and Aroon Down 0. On the 10:05 candle price set a new 25-candle low, Aroon Down shot to 100 with Aroon Up near 28, and the cloud flipped from green to pink.
The Sell Arrow did not land on 10:05. It printed one candle later, on the long red 10:10 candle that ran from 4180.69 down to 4172.69, where the Data Window shows Aroon Up 24 and Aroon Down 100. Max bars after Aroon trigger allows this kind of wait: an arrow may come up to 3 candles after the Aroon condition starts, and a later one is dropped as stale.
A short trade could keep its stop above 4181.41, the top of the arrow candle and 8.72 over its close. By 13:00 the low had reached 4150.11, 22.58 under the 10:10 close. The next arrow on the chart was a Buy at 13:20, 38 candles after the Sell, exactly the alternation the Inputs tab asks for.
Indicator Settings
The Inputs tab of Aroon Trend Signals MT5 holds 17 settings in five groups: Aroon, Signals, Filters, Timing (anti-lag) and Panel.
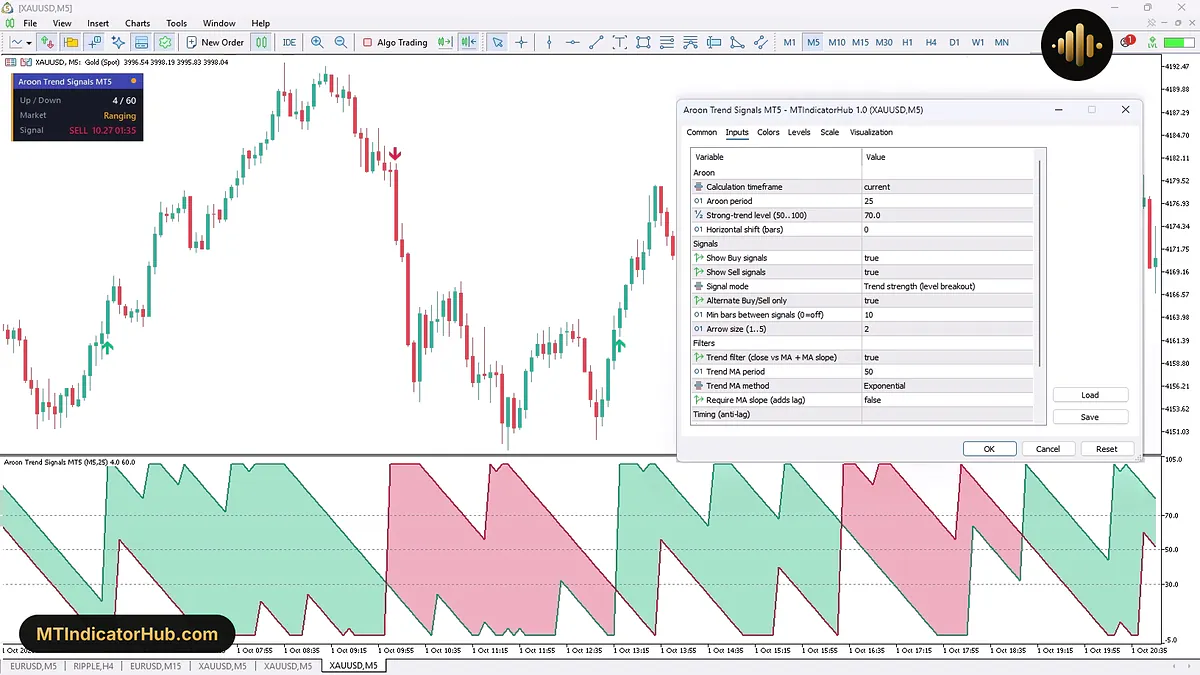
The image shows the list from Calculation timeframe down to the Timing (anti-lag) header; the two timing rows and Show info panel sit below the scroll. Signal mode is a list with two entries, Trend strength (level breakout) and Aroon Up/Down crossover.
| Input | Default | What it changes |
|---|---|---|
| Aroon: which candles and levels the two lines use | ||
| Calculation timeframe | current | Timeframe whose closed candles feed the lines; a higher one can be picked, a lower one cannot |
| Aroon period | 25 | How many candles back the highest high and lowest low are looked for |
| Strong-trend level (50..100) | 70.0 | Level the leading line must reach for an arrow and for Bullish or Bearish; the other line must stay under its mirror, 30 at the default |
| Horizontal shift (bars) | 0 | Moves the lines in the lower window sideways |
| Signals: when and how arrows are drawn | ||
| Show Buy signals | true | Turns the Buy Arrows on or off |
| Show Sell signals | true | Turns the Sell Arrows on or off |
| Signal mode | Trend strength (level breakout) | The level rule, or Aroon Up/Down crossover, which fires when the two lines cross |
| Alternate Buy/Sell only | true | Makes Buy and Sell Arrows take turns |
| Min bars between signals (0=off) | 10 | Fewest candles between two arrows |
| Arrow size (1..5) | 2 | Size of the arrows on the chart |
| Filters: the moving average check on price | ||
| Trend filter (close vs MA + MA slope) | true | Allows a Buy only with the close above the average and a Sell only below it |
| Trend MA period | 50 | Length of that average |
| Trend MA method | Exponential | Type of that average |
| Require MA slope (adds lag) | false | When true, the average must also point the way of the signal, so arrows come later |
| Timing (anti-lag): how late an arrow may come | ||
| Confirm: candle direction + Aroon line m… | true | A Buy needs a higher close and an Aroon Up line that is not falling; a Sell needs the mirror |
| Max bars after Aroon trigger (0=off) | 3 | Drops an arrow that would come more candles than this after the Aroon condition began; 0 removes the limit |
| Panel: the box in the chart corner | ||
| Show info panel | true | Turns the Up / Down, Market and Signal box on or off |
All counts in this list are candles of the calculation timeframe. On the M5 chart of the examples, Aroon period 25 looks back 2 hours 5 minutes, Min bars between signals 10 keeps arrows at least 50 minutes apart, Max bars after Aroon trigger 3 allows a wait of 15 minutes, and the 50-period average spans 4 hours 10 minutes; on M15 the same 25 candles cover 6 hours 15 minutes.
Conclusion
The Aroon Trend MT5 indicator asks which side set the more recent extreme over the last 25 candles and whether that lead is strong enough to call a trend. It marks the moment one Aroon line reaches 70 while the other stays at 30 or lower with a single arrow, and shows the state in between through its green or pink cloud and the Market row of the panel.
Aroon counts candles, not distance, so a new high by a small margin lifts Aroon Up to 100 just as a strong breakout does. Arrows wait for the close, the filters can hold one back for a few candles, and past the Max bars after Aroon trigger limit it is not drawn at all. Because Alternate Buy/Sell only is on by default, a fresh wave in the direction of the last arrow stays unmarked, even while the cloud and the panel still show it. In a sideways market where neither line reaches 70, the panel stays on Ranging and no arrow prints. No alert input exists among the 17 settings, so a new arrow has to be seen on the chart itself, and Calculation timeframe cannot be set below the chart's own timeframe.
Your rating
Rate this indicator
How useful was this indicator? Click a star.
FAQ
Frequently asked questions
The cloud fills the gap between the two Aroon lines. Green means Aroon Up is higher, so the latest 25-candle high is more recent than the latest low; pink means the low is the fresher extreme. Colour alone does not make an arrow: in the default mode one line also has to reach 70 while the other is at 30 or less.
The Market row switches to Bullish or Bearish only when the leading line has reached the Strong-trend level, 70 by default. With a reading such as 4 / 60, Aroon Down leads but stays short of 70, so the row reads Ranging and the strip and dot turn orange.
Each Aroon setup carries one arrow, and Alternate Buy/Sell only makes arrows take turns, so after a Buy the next arrow can only be a Sell. Aroon Up can sit near 100 through a whole rally: on the M5 chart of 1 October 2026 the 06:05 Buy Arrow stayed alone until the Sell Arrow of 10:10.
With Signal mode set to Aroon Up/Down crossover, the trigger is the two lines crossing instead of the 70 and 30 levels: Aroon Up moving above Aroon Down for a Buy, below it for a Sell. That is the candle where the cloud changes colour, so arrows no longer wait for a line to reach the Strong-trend level.
Yes, through Calculation timeframe. Pick a higher timeframe and the lines and arrows follow the closed candles of that timeframe while the chart itself stays faster; a timeframe lower than the chart's cannot be chosen. At the default, current, everything follows the chart.






Comments
Be the first to comment.