



On MetaTrader 4, the Trend Continuation Oscillator indicator tracks whether buyers or sellers are still pushing price the same way, using two values plotted in a subwindow, Bull Continuation and Bear Continuation, with the gap between them shaded green or red. Its arrows go on the candles: a Buy Arrow below the bar where Bull Continuation turns positive and a Sell Arrow above the bar where Bear Continuation turns positive.
MT4 oscillator with Bull and Bear Continuation values; a Buy or Sell arrow marks the bar where either one turns positive.
Trend Continuation Oscillator Specifications
The MT4 build plots both continuation values in a subwindow under the candles and decides on an arrow only after the bar is complete.
| Item | Details |
|---|---|
| Platform | MetaTrader 4 (MT4); also available for MT5 |
| Categories | Oscillators, Signal & Forecast |
| Indicator type | Trend, Entry Exit |
| Skill level | Beginner |
| Timeframes | Any; shown here on M5 and M15 |
| Trading style | Scalper, Intraday |
| Markets | Forex, Commodities, Indices, Crypto, Stock (shown on XAUUSD) |
| Display | Subwindow with Bull Continuation and Bear Continuation, the space between them shaded green or red, and a dotted 0.00 level; Buy Arrows below and Sell Arrows above the bars; panel with three rows (Value, Market, Last Signal) |
| Alerts | None |
| Version | 1.0 |
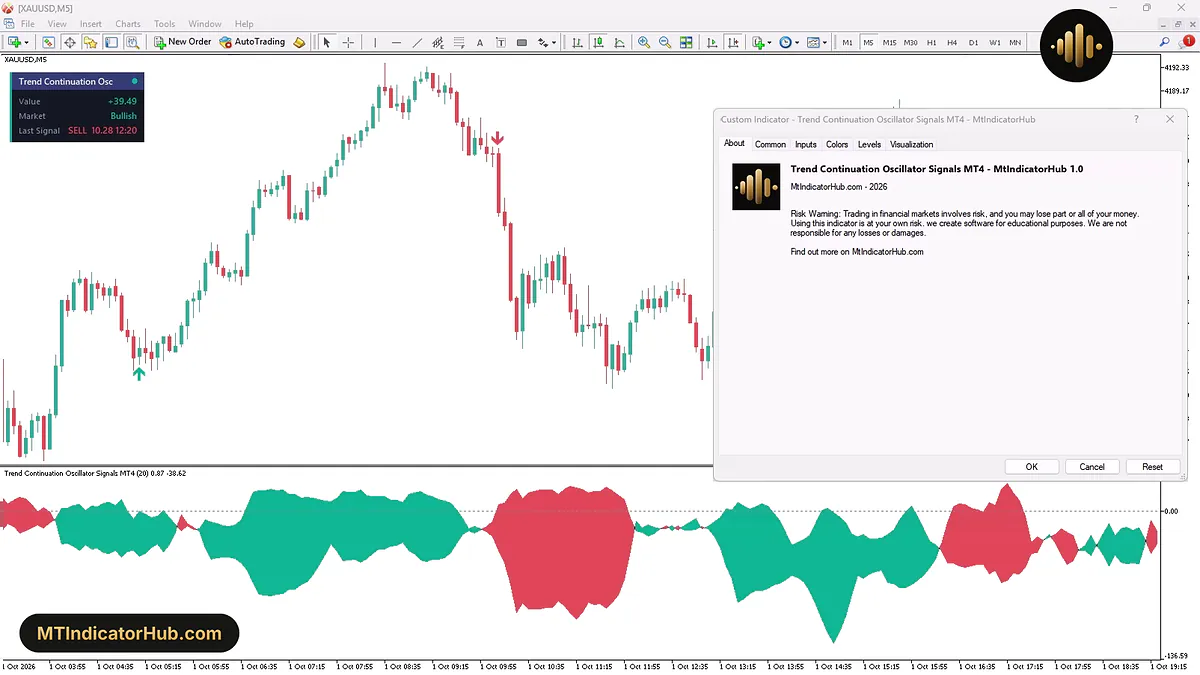
With the About tab open, the panel in the corner of the XAUUSD,M5 window still reports Market Bullish with a Value of +39.49. Underneath the bars, the subwindow alternates green and red shading on both sides of 0.00.
What Is the Trend Continuation Oscillator Indicator?
The Trend Continuation Oscillator is an MT4 oscillator that answers one question about the market trend: is the current run still being extended? It checks the change in the close from bar to bar, adds up runs of higher closes, or of lower closes, for as long as they last, and weighs that total across the most recent 20 bars, the Oscillator period. Bull Continuation is the result for the up side and Bear Continuation the result for the down side.
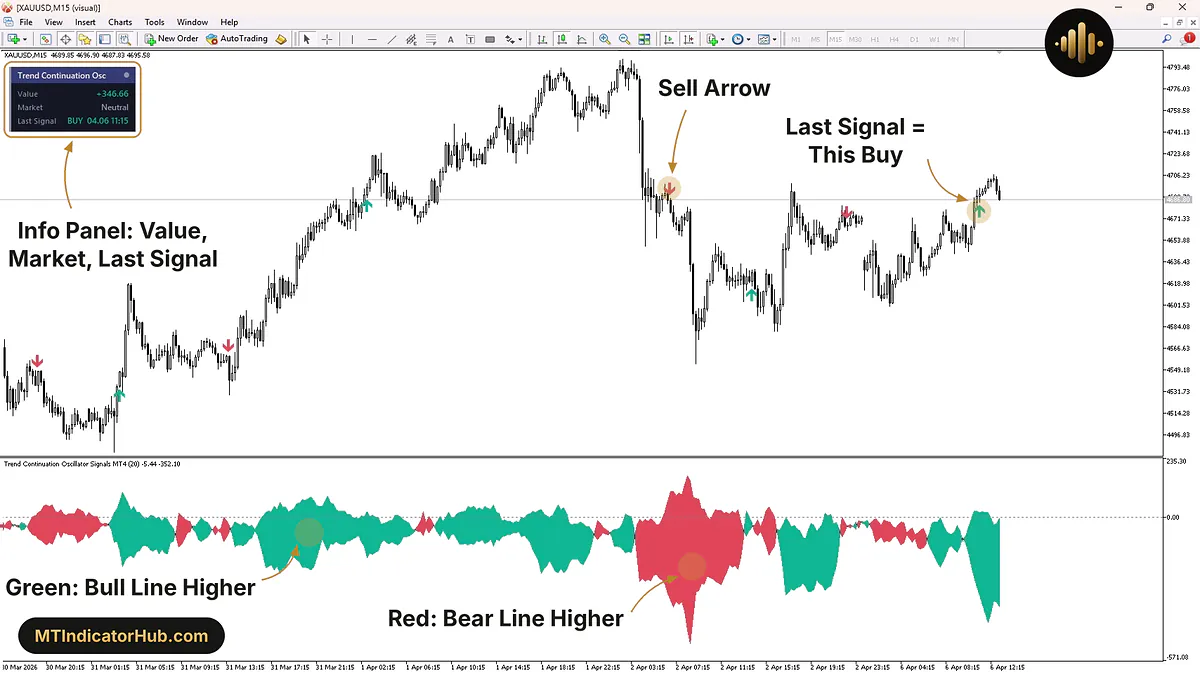
Both values share the subwindow. Where Bull Continuation sits higher, the band between them is shaded green; where Bear Continuation sits higher, it turns red. The dotted 0.00 level divides the window into positive and negative halves, and each arrow is tied to a crossing of that level, never to a change of shade.
Three rows make up the panel headed Trend Continuation Osc:
- Value: Bull Continuation minus Bear Continuation on the latest bar, positive whenever the green side leads;
- Market: Bullish once Bull Continuation is positive, Bearish once Bear Continuation is positive, Neutral while both are negative;
- Last Signal: the type of the most recent arrow with its date and time.
On MT4 the subwindow caption, Trend Continuation Oscillator Signals MT4 (20), is followed by both values.
The Strategy Tester run below shows why the panel can look odd at first. Value reads +346.66, yet Market says Neutral, because the caption puts Bear Continuation at -352.10 and Bull Continuation at -5.44, both negative.
Buy Signal
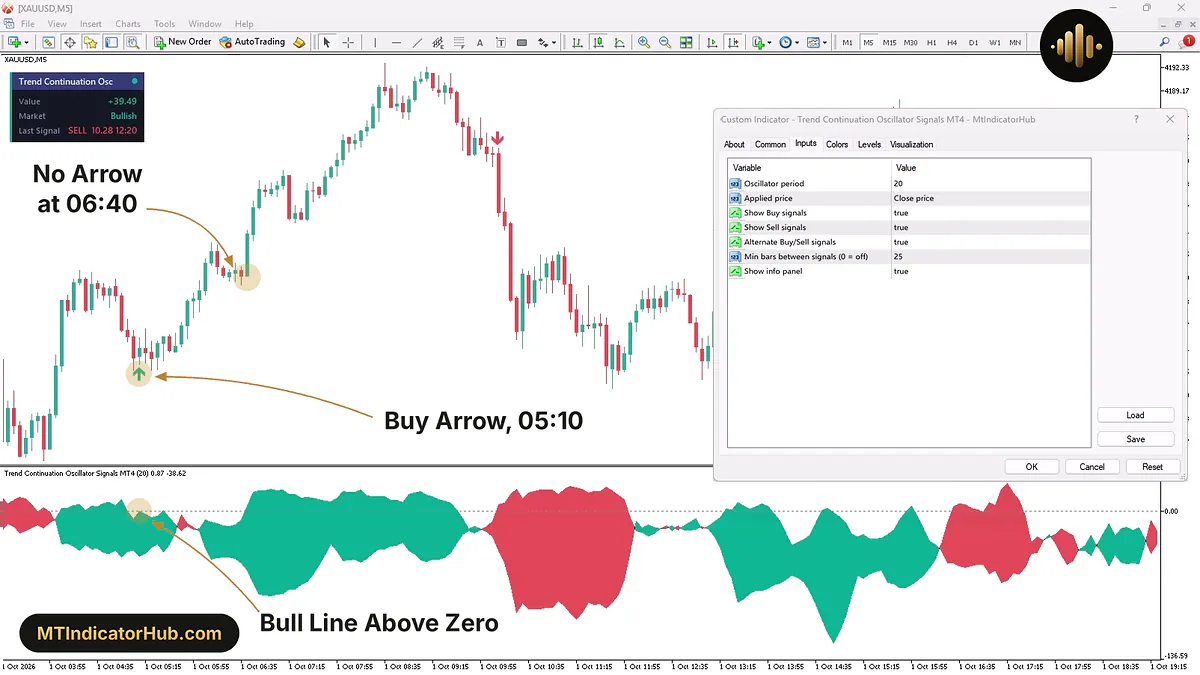
The Buy Arrow is placed below the bar whose close moves Bull Continuation from a negative reading to a positive one. Green shading by itself never triggers it.
The sequence is clear on XAUUSD,M5 during the morning of 1 October 2026. The 05:05 bar left Bull Continuation at -7.05, the 05:10 bar lifted it to 0.64, and the arrow appeared under that bar (open 4153.30, high 4155.84, low 4152.21, close 4154.33). With Bear Continuation down around -41, the band stayed green throughout.
Two later crossings drew nothing. Bull Continuation went positive again at 05:30 (0.79) and at 06:40 (4.77), only 4 and 18 bars after the arrow. Min bars between signals asks for 25, and Alternate Buy/Sell signals at true reserves the next arrow for the sell side.
From 06:40 Bull Continuation stayed positive to roughly 09:35 while gold climbed; the 08:35 bar topped out near 4193.01, about 38.68 over the 05:10 close.
For a long position the 05:10 bar gives both levels: buy once the 4154.33 close is in and protect below the 4152.21 low, 2.12 of risk. The exit can come from the same line. By 09:45 Bull Continuation was back at -15.47, under 0.00, so the run behind the arrow had ended.
Sell Signal
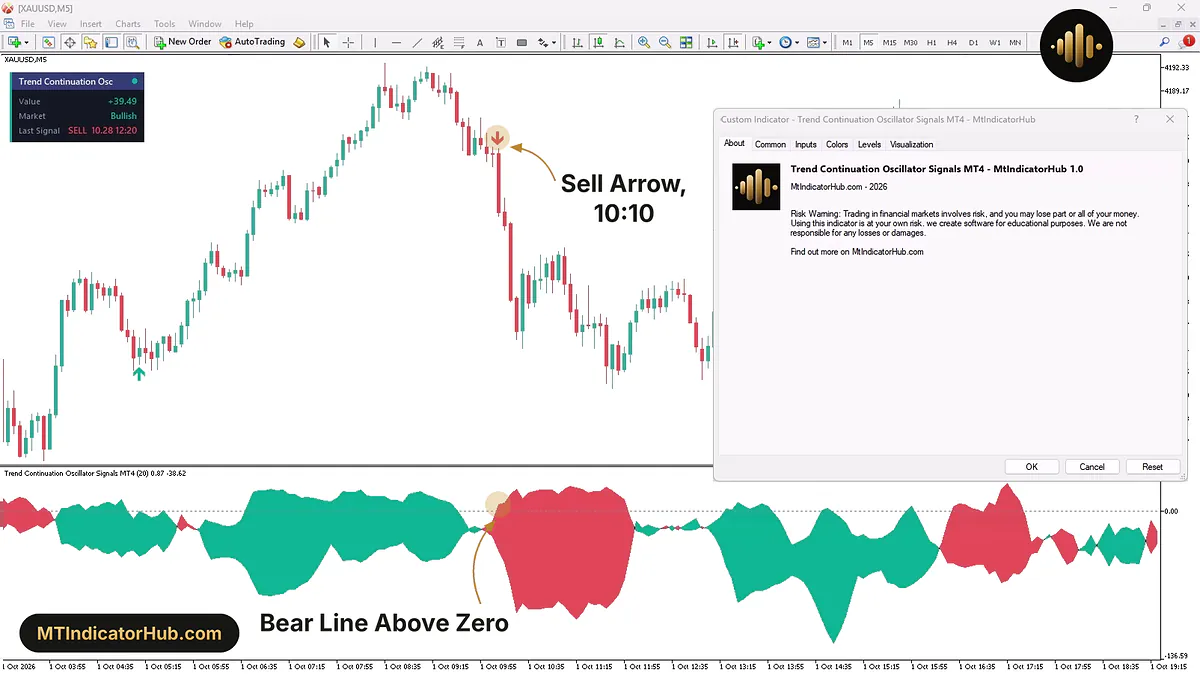
The Sell Arrow applies the rule to the other value: it is printed above the bar on which Bear Continuation moves from below 0.00 to above it. Red shading may come earlier, the moment the Bear line climbs over the Bull line while both are still negative; the arrow ignores that and waits.
The red band appeared on the same chart at 10:00, with Bear Continuation still negative, near -6.9 on the 10:05 bar. The 10:10 bar took it to about +6.9 while Bull Continuation went the other way, -23.30 to -36.02. That bar ran from a 4180.69 open to a 4172.69 close, 8.00 lower. Sixty bars had passed since the 05:10 Buy, so the Sell Arrow went above the 10:10 bar with neither filter stepping in.
Bear Continuation then held above zero until around 11:55, Bull Continuation sank to -93.88 at 11:10, and price slid to about 4148.93 on the 11:45 bar, some 23.76 below the 10:10 close.
A short entered on this signal would put its stop beyond the 10:10 high of 4181.41, which is 8.72 above the close. Once Bear Continuation drops back below 0.00, as it did around 12:00, the selling continuation is over.
Indicator Settings
MQL4 has no input groups, so on MT4 the same seven settings appear as one plain list in the Inputs tab.
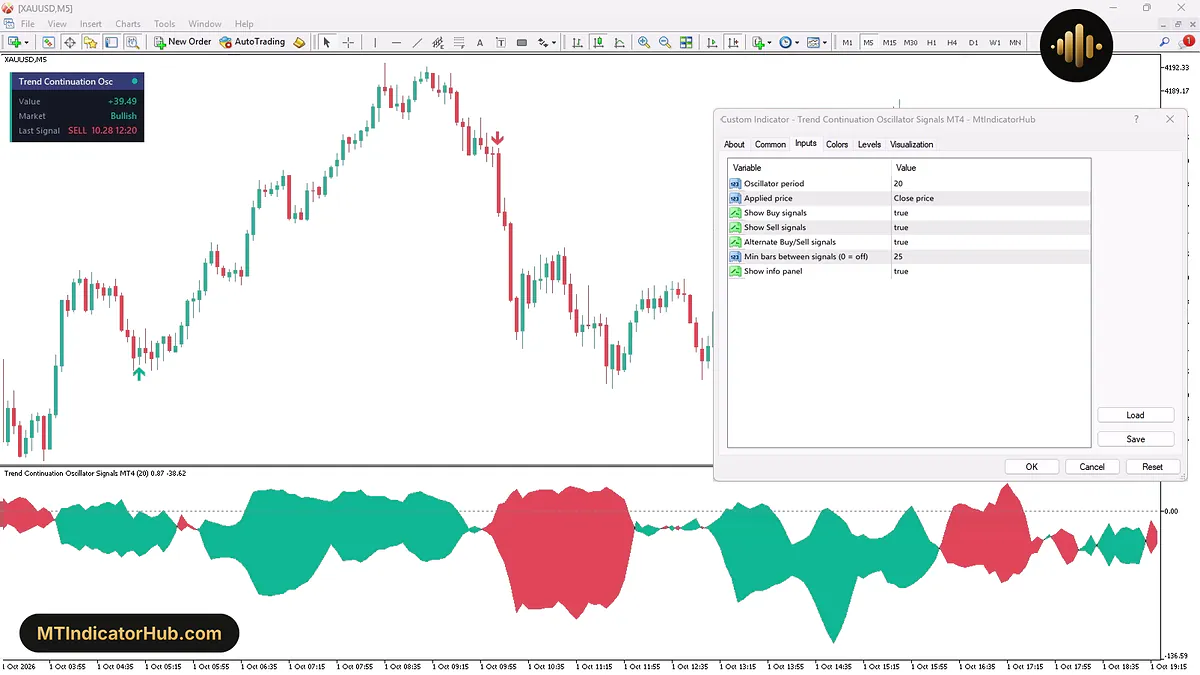
The top two rows, Oscillator period and Applied price, change the lines themselves. The next four only filter or hide arrows, and the last row controls the panel.
| Input | Default | What it changes |
|---|---|---|
| Oscillator period | 20 | Number of recent bars behind both lines; lower values react quicker and give more arrows, higher values give smoother lines and fewer arrows |
| Applied price | Close price | Which bar price the up and down runs are measured from |
| Show Buy signals | true | Set to false to hide every Buy Arrow |
| Show Sell signals | true | Set to false to hide every Sell Arrow |
| Alternate Buy/Sell signals | true | When true, a Buy and a Sell must follow each other in turn |
| Min bars between signals (0 = off) | 25 | Bars that must pass before the next arrow; 0 disables the wait |
| Show info panel | true | Displays or hides the Trend Continuation Osc box |
Both counts are in bars. On M1, Oscillator period 20 is 20 minutes and the 25-bar gap 25 minutes; on H1 the same settings stretch to 20 hours and 25 hours.
Conclusion
On MT4 the Trend Continuation Oscillator gives a closed-bar verdict on whether the up side or the down side is still carrying price forward, and it marks the first bar where either continuation value turns positive.
That bar has to finish first, so the arrow never leads the move. Green or red shading by itself means nothing for the arrows, and two negative values keep the panel on Neutral even when Value is large. Alternate Buy/Sell signals allows only one arrow per side in a row, Min bars between signals spaces arrows 25 bars or more apart, and no input offers an alert of any kind. When older bars are on screen, the panel still reports the latest one.
Your rating
Rate this indicator
How useful was this indicator? Click a star.
FAQ
Frequently asked questions
They are the two values the indicator plots. Bull Continuation grows while closes keep rising bar after bar, and Bear Continuation grows while closes keep falling. A positive Bull Continuation means the up run is being extended; a positive Bear Continuation means the same for the down run.
Both values can be negative at the same time, as in our tester example, where Bear Continuation was -352.10 and Bull Continuation -5.44. The panel then reads Neutral, and the green or red shading only shows which of the two negative values is the higher one.
The shade only compares the two lines with each other, so it can flip many times in a quiet market. A move above 0.00 says one side is actually being continued, which is why the Buy and Sell Arrows are tied to that crossing.
Oscillator period changes how fast the lines react, so a smaller value gives more crossings. Min bars between signals and Alternate Buy/Sell signals then remove arrows that come too soon or on the same side, and Show Buy signals or Show Sell signals can hide one side completely.





Comments
Be the first to comment.