


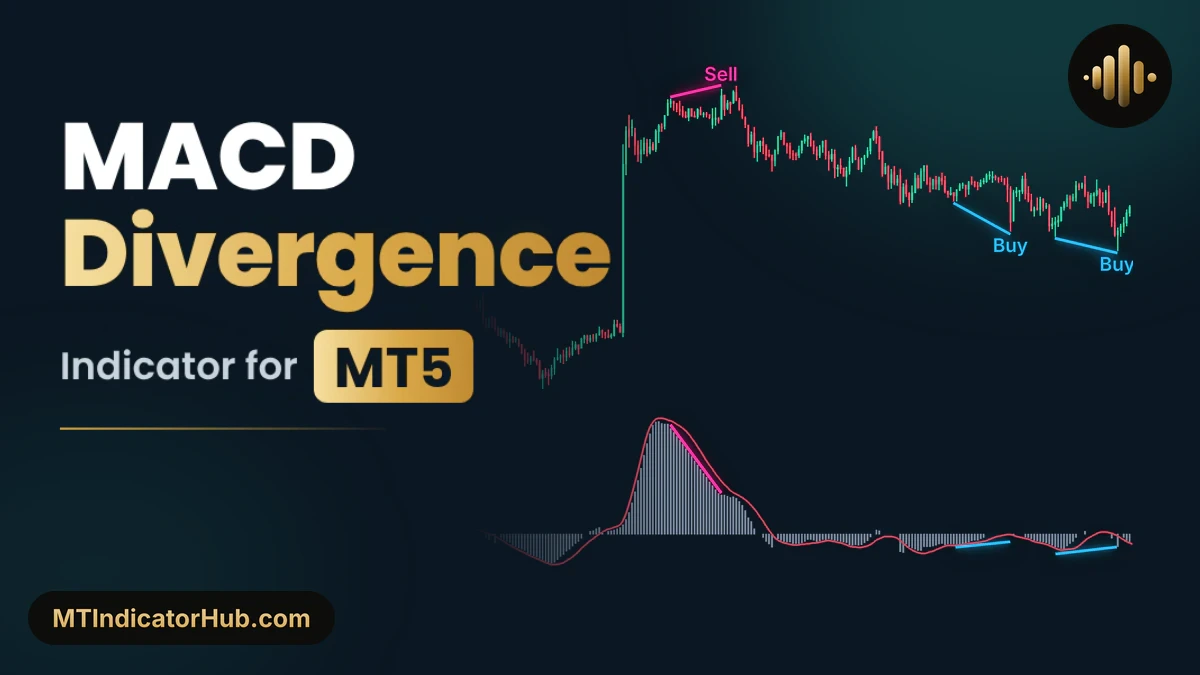
The MACD Divergence MT5 indicator looks for two swing points of the same kind where price and the MACD histogram move in opposite directions. When a lower low meets a higher histogram reading, it joins the two lows with a DeepSkyBlue line and writes Buy under the second one; when a higher high meets a lower reading, the line is DeepPink and the label says Sell.
Pairs two swing points 5 to 30 candles apart with the MACD histogram and draws a blue Buy or pink Sell line on both windows when they disagree.
MACD Divergence Specifications
The MACD Divergence indicator keeps a standard MACD in its own window under the chart and places its divergence drawings on the candles and across the histogram.
| Item | Details |
|---|---|
| Platform | MetaTrader 5 (MT5); also available for MT4 |
| Categories | Oscillators, Signal & Forecast |
| Indicator type | Divergence, Reversal |
| Skill level | Beginner |
| Timeframes | Any; shown here on M15 |
| Trading style | Intraday, Day Trading |
| Markets | Forex (shown on USDJPY and EURUSD) |
| Display | MACD histogram and Signal line in a separate window; divergence lines on the candles and on the histogram, with Buy and Sell labels |
| Alerts | None |
| Version | 1.05 |
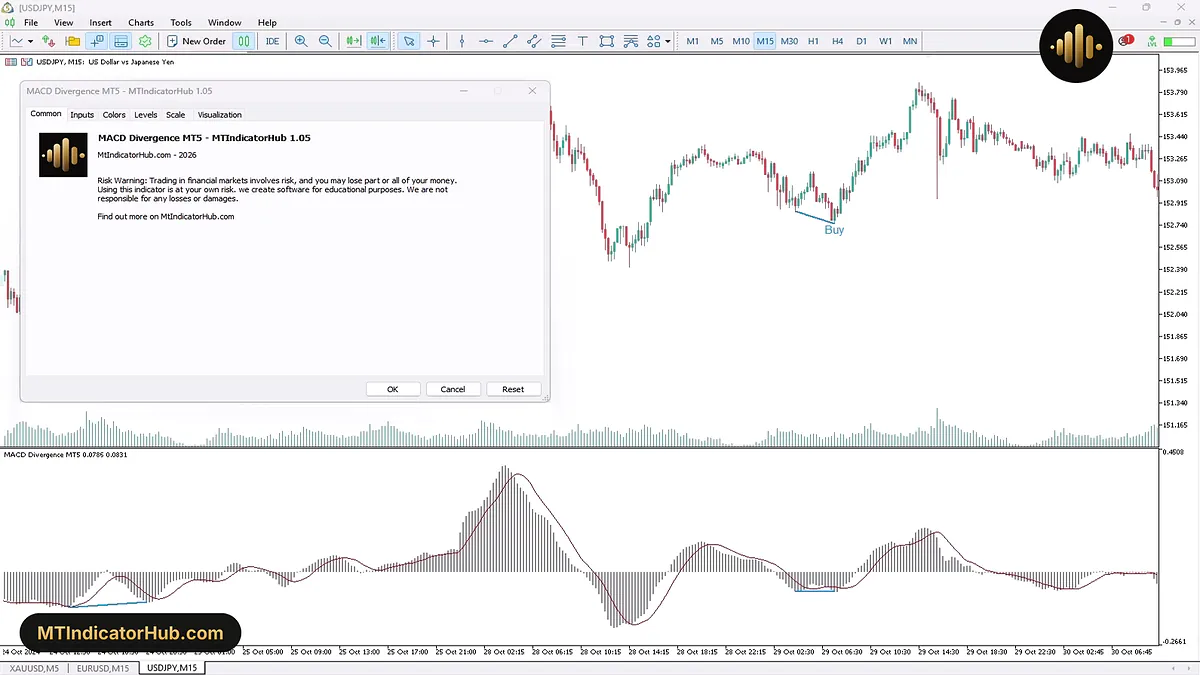
With the Common tab open on USDJPY M15, the indicator window underneath already carries two DeepSkyBlue lines, the bullish divergences of 24 and 29 October 2024. Both sit under the zero line, where the grey MACD bars are negative.
What Is the MACD Divergence Indicator?
The MACD Divergence indicator is a divergence finder built on the MACD, the Moving Average Convergence Divergence oscillator. Its window shows the MACD as grey histogram bars, made from a Fast EMA period of 12 and a Slow EMA period of 26 on the Close price, together with a dark red Signal line that smooths those bars over 9 periods. The Data Window lists the two values as MACD and Signal.
On the price side, the tool uses 8 candles to decide what counts as a swing high or low, a pivot, and pairs each new pivot with an earlier one of the same kind. A bullish divergence is a lower low on the candles while the histogram at that low is higher than at the earlier one. A bearish divergence is a higher high while the histogram at that high is lower.
Three inputs set how strict a match must be. The Minimum and Maximum distance between two pivots keep each pair 5 to 30 candles apart, and the line joining the two histogram values may be crossed by no more than 8 grey bars, the default of Number of MACD that break the line. With a ninth bar through it, that divergence is not shown, so a higher value lets rougher shapes through and a lower one keeps only clean ones.
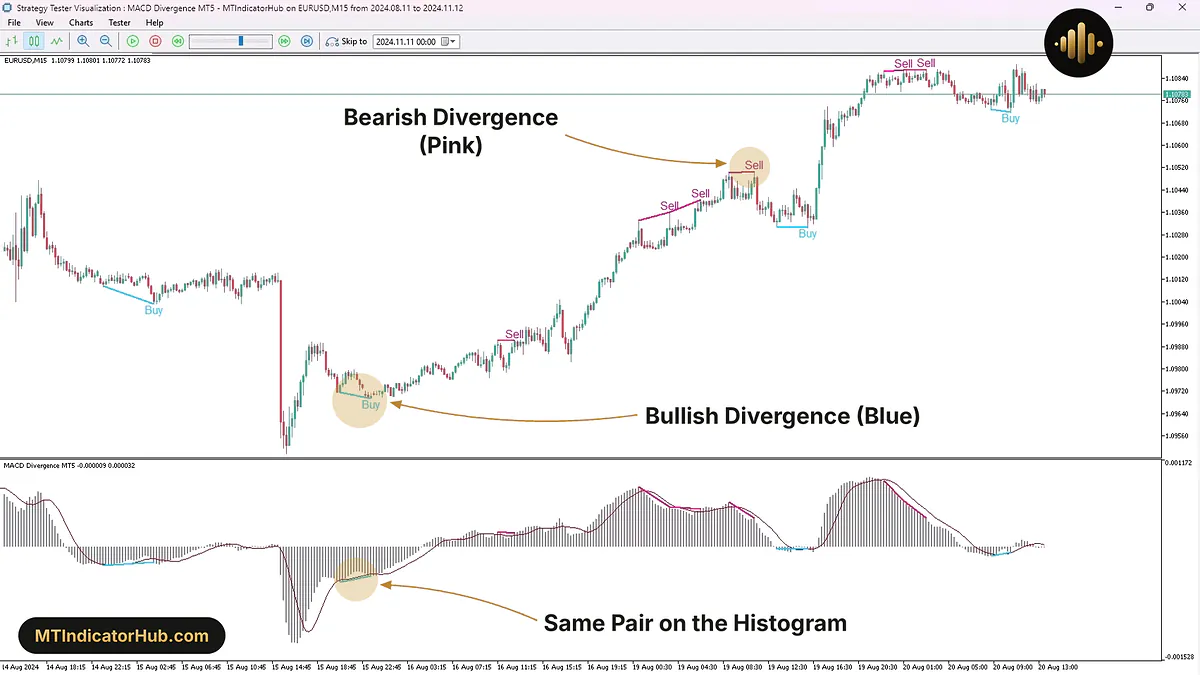
Every drawing has three parts: a line across the two pivots on the chart, a line across the two histogram values in the indicator window, and a text label, Buy below a bullish pair or Sell above a bearish one. Both lines take the colour of their side at Width 2.
Bullish Divergence
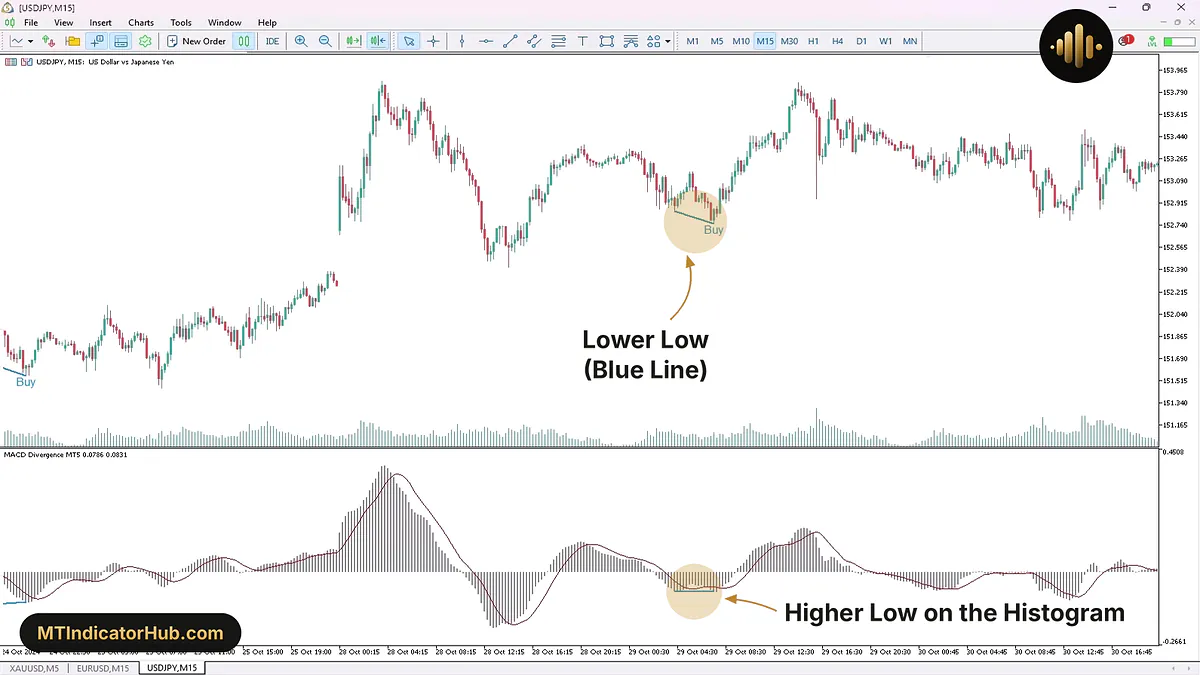
On USDJPY M15 on the morning of 29 October 2024, the 04:15 candle set a low of 152.851 with the histogram at -0.0703; thirteen candles later, the 07:30 candle dipped to 152.755, 9.6 pips lower, while the histogram read -0.0682.
Below zero, the higher of two readings is the one closer to zero, so -0.0682 stands above -0.0703 even though both carry a minus sign: price made a new low, the MACD bars did not.
The indicator joined the two lows with a DeepSkyBlue line ending at 07:30, printed Buy beneath it and drew the matching line between the two histogram bars in the lower window. With shift at its default of 2, the check for this pair runs two candles after the 07:30 pivot.
What came next on the same chart fits the drawing: the 08:00 candle opened at 152.833 and closed at 153.024, and the 08:15 candle reached 153.070, 31.5 pips above the second low. For anyone reading the shape as a long idea, 152.755 is the level that would cancel it, since trading below it creates a newer and lower low.
Bearish Divergence
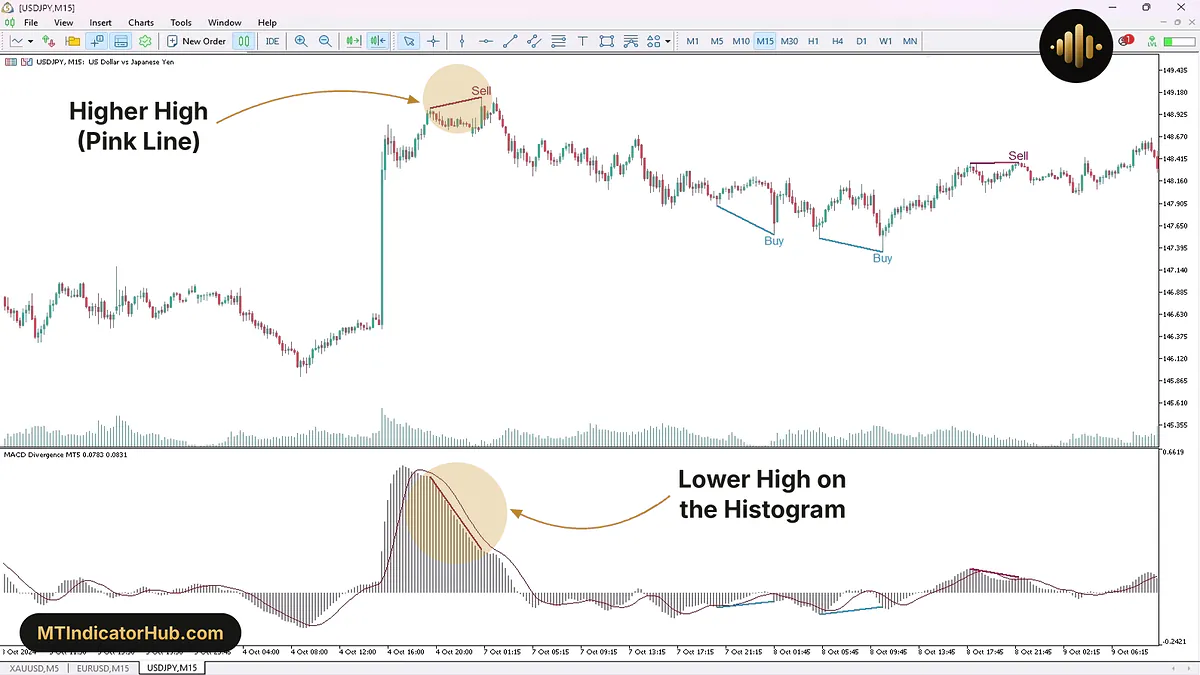
The bearish example on the same USDJPY M15 chart spans a weekend. The first high formed on Friday 4 October 2024 at 19:30, at 149.003, with the histogram at 0.5315. The second came on Monday 7 October at 01:00: a high of 149.124, 12.1 pips above the first, with the histogram down to 0.1990.
On the clock the gap covers more than two days, yet the pivot distance is counted in candles, not hours. Only 17 M15 candles separate 19:30 on Friday from 01:00 on Monday, well inside the Maximum distance between two pivots of 30, so the pair qualified: a DeepPink line joined the two highs and Sell appeared above the second one.
In the indicator window the second line drops steeply, from 0.5315 to 0.1990, a fall of 0.3325 in the histogram.
Price turned lower through the early Monday session. By 04:45 the candle low stood at 148.342, 78.2 pips under the 149.124 high that carries the Sell label.
Indicator Settings
The Inputs tab holds 14 settings: four for the MACD, six for how pivots are found and paired, three for the drawings and one theme choice under its own header.
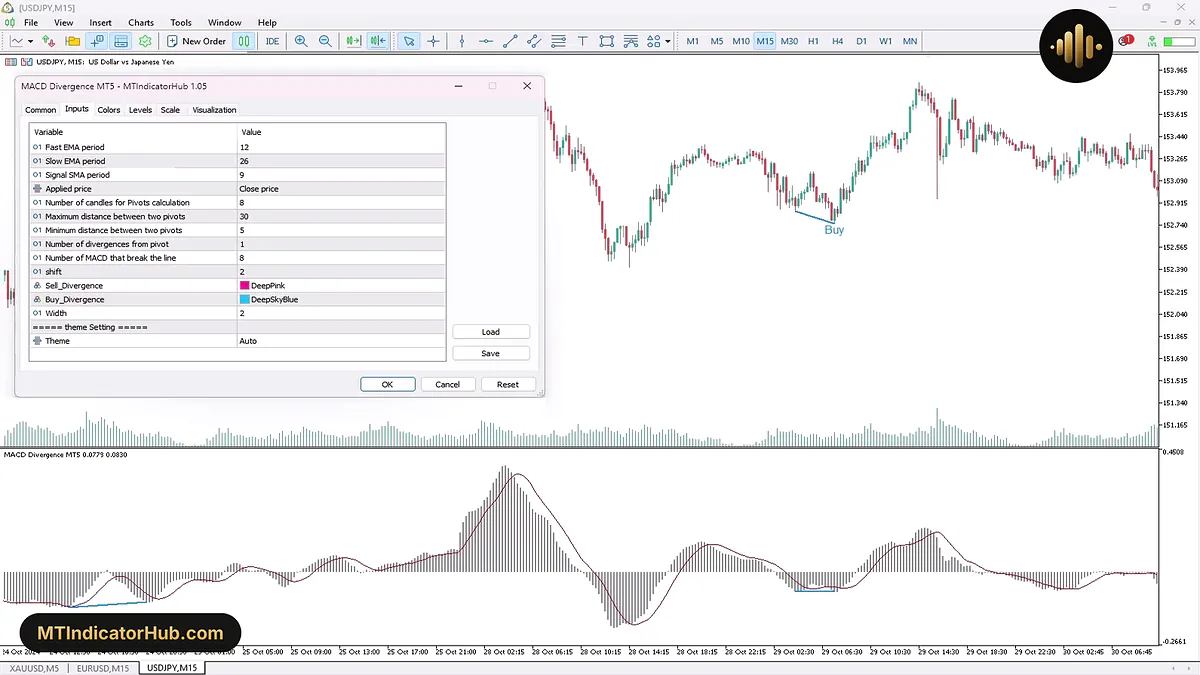
A separate theme Setting header keeps Theme, at Auto, apart from the rest. The two colour rows show their swatches next to the names: DeepPink for Sell_Divergence and DeepSkyBlue for Buy_Divergence.
| Input | Default | What it changes |
|---|---|---|
| Fast EMA period | 12 | Faster of the two averages behind the MACD histogram |
| Slow EMA period | 26 | Slower of the two averages behind the MACD histogram |
| Signal SMA period | 9 | Smoothing of the dark red Signal line |
| Applied price | Close price | Price the MACD is built from; High, Low, Median, Typical and Weighted price are among the other choices |
| Number of candles for Pivots calculation | 8 | How many candles decide whether a high or low is a pivot |
| Maximum distance between two pivots | 30 | Largest gap, in candles, between the two pivots of one divergence |
| Minimum distance between two pivots | 5 | Smallest gap, in candles, between the two pivots |
| Number of divergences from pivot | 1 | How many divergence lines may start from one pivot |
| Number of MACD that break the line | 8 | Histogram bars allowed to cross the line in the MACD window before the divergence is dropped |
| shift | 2 | Candles the indicator waits after a pivot before it checks for a divergence |
| Sell_Divergence | DeepPink | Colour of the bearish lines and the Sell label |
| Buy_Divergence | DeepSkyBlue | Colour of the bullish lines and the Buy label |
| Width | 2 | Thickness of the divergence lines |
| theme Setting: the colour theme of the indicator | ||
| Theme | Auto | Auto, Light, Dark or Custom |
The pivot inputs are candle counts, so their length in time follows the chart. On M15 the 8-candle pivot setting covers 2 hours and a pair may sit from 1 hour 15 minutes to 7 hours 30 minutes apart; on H1 the same defaults stretch to 8 hours and 5 to 30 hours.
Conclusion
The MACD Divergence MT5 indicator does one job: it finds two swing points 5 to 30 candles apart where price and the MACD histogram disagree, then marks each pair in both windows: a blue or pink line with its Buy or Sell label on the candles, and a twin line across the MACD bars.
Its rules also leave out some divergences a trader may spot by eye. A pair 31 or more candles apart gets no line, and neither does one whose histogram line is crossed by more than 8 bars. Each check waits for the 2-candle shift past the newest pivot, so the line arrives after the turning candle, not on it. With Number of divergences from pivot at 1, a pivot starts one line at most, and the Inputs tab has no alert option, so new drawings are found by watching the chart.
Your rating
Rate this indicator
How useful was this indicator? Click a star.
FAQ
Frequently asked questions
It marks a bullish divergence that passed the indicator's rules: the newer swing low is below the older one, while the MACD histogram at the newer low is higher. In the USDJPY M15 example of 29 October 2024, the low slipped from 152.851 to 152.755 and the histogram rose from -0.0703 to -0.0682.
Three inputs decide it. The two pivots must be between 5 and 30 candles apart, each one needs the 8-candle pivot window to count as a swing, and no more than 8 histogram bars may pass through the line in the MACD window. A divergence that breaks any of these stays undrawn; changing the matching input brings it in.
It compares price with the grey histogram, shown as MACD in the Data Window, and not with the dark red Signal line. By default the bars come from the 12 and 26 exponential averages of the Close price; switching Applied price to High, Low, Median, Typical or Weighted price changes the bars and so the divergences found.
It counts candles, not hours. On USDJPY M15 the highs at 19:30 on Friday 4 October and at 01:00 on Monday 7 October were only 17 candles apart, inside the 30-candle maximum, so they were joined with a Sell line.
Shift sets how many candles the indicator steps away from a pivot before it looks for a divergence. At the default of 2, the drawing for a new low or high is decided two candles after that pivot; a larger value waits longer.






Comments
Be the first to comment.