


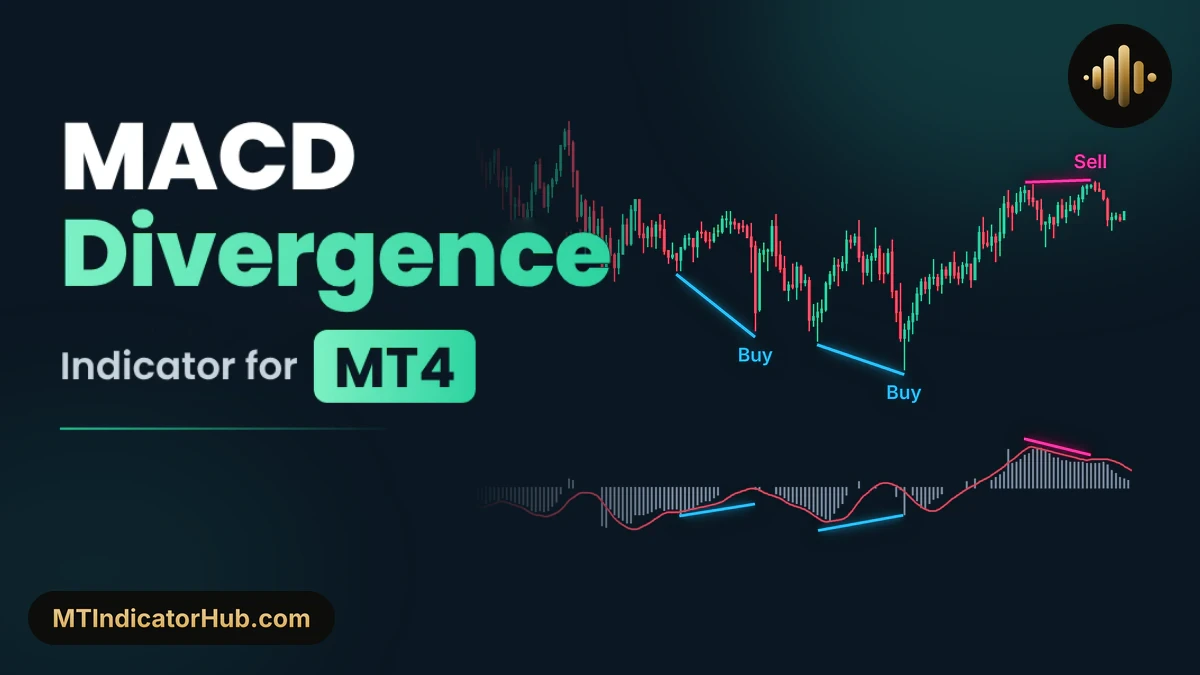
The MACD Divergence MT4 indicator checks every new swing high and low of the candles against the MACD histogram on that same candle and marks the pairs that disagree. A bearish pair gets a DeepPink line and a Sell label; a bullish pair gets a DeepSkyBlue line and a Buy label.
Sets each new swing high or low against the MACD histogram, then marks a labelled Buy or Sell line on MetaTrader 4 wherever the two move apart.
MACD Divergence Specifications
The download holds one file, MACD Divergence MT4 - MTIndicatorHub.ex4, which opens in MetaTrader 4 under the title Custom Indicator - MACD Divergence MT4 - MTIndicatorHub.
| Item | Details |
|---|---|
| Platform | MetaTrader 4 (MT4); also available for MT5 |
| Categories | Oscillators, Signal & Forecast |
| Indicator type | Divergence, Reversal |
| Skill level | Beginner |
| Timeframes | Any; shown here on M15 |
| Trading style | Intraday, Day Trading |
| Markets | Forex (shown on USDJPY and EURUSD) |
| Display | Grey MACD histogram and dark red Signal line in its own window; Buy and Sell lines with labels on the candles, matching lines on the histogram |
| Alerts | None |
| Version | 1.0 |
MetaTrader 4's Data Window lists the tool as Indicator window 1 with two rows, MACD and Signal. For the 03:45 candle of 8 November 2024 (USDJPY M15) they read 0.0295 and 0.0056. The MACD row is the histogram value the indicator compares at each pivot, so moving the cursor over two pivot candles shows the pair of numbers behind a drawing.
What Is the MACD Divergence Indicator?
The MACD Divergence indicator reads divergence from the MACD (Moving Average Convergence Divergence). The grey bars in its window are the MACD values, the distance between a 12-period and a 26-period exponential moving average, and the dark red curve is the Signal line, a 9-period simple average of the bars. Divergences are judged on the bars alone; the Signal line plays no part in them.
To find the pairs, the tool first marks pivots: highs and lows that stand out over 8 candles, as set by Number of candles for Pivots calculation. A new pivot is then set against an older pivot of its own type lying 5 to 30 candles earlier. Two lows form a bullish divergence when the later one is lower on the chart but higher on the histogram; two highs form a bearish one when the later high is higher while its bar is lower.
On the histogram side, the indicator lays a straight line from the first histogram value to the second, and when over 8 grey bars cut through it (Number of MACD that break the line is 8 by default), the pair is skipped and nothing is drawn. Raising that number lets bumpier histograms through.
Each accepted pair is drawn twice in its side's colour at Width 2: once between the two pivot candles on the price chart and once between the two matching bars in the MACD window. The Buy or Sell label goes next to the second pivot, under a low and over a high.
Bullish Divergence
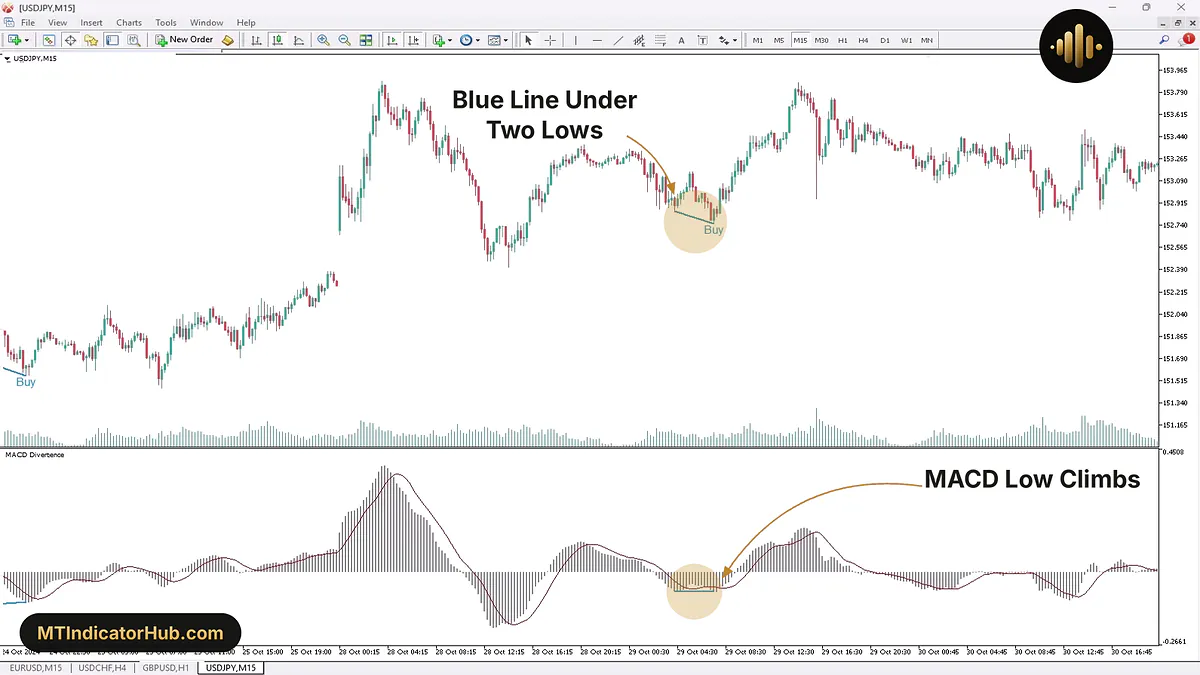
USDJPY M15 on 29 October 2024 holds a clean bullish pair. At 04:15 the candle low was 152.851 and the histogram stood at -0.0703. Thirteen candles on, at 07:30, price went 9.6 pips deeper, to 152.755, but the histogram printed -0.0682.
Both readings are negative, so the one nearer zero is the higher: -0.0682 sits 0.0021 above -0.0703, a rising histogram under a falling low.
The indicator answered with a Buy line across the two lows, the Buy label under 152.755 and a twin line over the matching histogram bars. The shift input, 2 by default, put the check on the 08:00 candle, two candles after the low.
That 08:00 candle ran from 152.833 at the open to 153.024 at the close, and at 08:15 the high reached 153.070, 31.5 pips over 152.755. The reading holds only while price stays above 152.755; a trade below it prints a lower low than the one the label marks.
Bearish Divergence
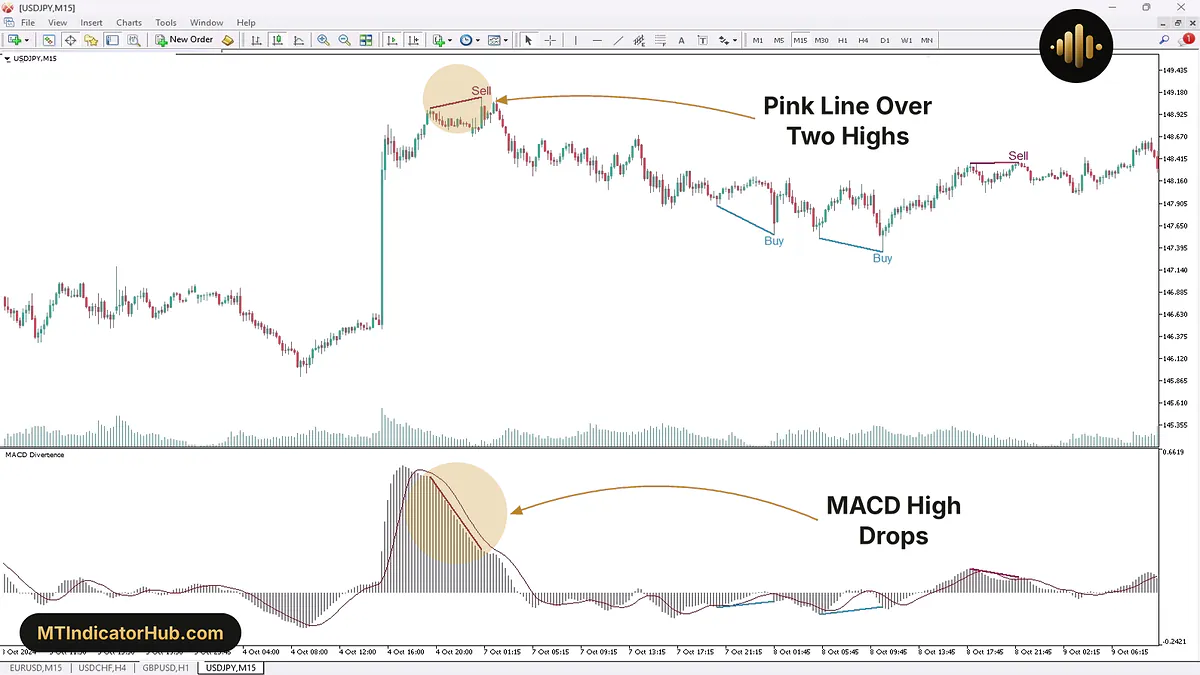
The bearish pair, also on USDJPY M15, has a weekend in the middle. The 19:30 candle of Friday 4 October 2024 made a high of 149.003 while the histogram showed 0.5315; the 01:00 candle of Monday 7 October went 12.1 pips further, to 149.124, as the histogram fell to 0.1990. Price gained 0.121 while the histogram lost 0.3325, more than 60 percent of its first reading.
The calendar shows more than two days between the highs, but the chart shows only 17 M15 candles, since nothing prints over the weekend. Pivot distance is a candle count, so 17 is far below the 30 allowed by Maximum distance between two pivots, and the pair got its Sell line and a Sell label above 149.124.
Three hours and 45 minutes after the second high, the 04:45 candle traded down to 148.342, which is 78.2 pips below 149.124.
Indicator Settings
The MetaTrader 4 build has 13 inputs in one flat list; the last of them, Theme, sits under the theme Setting header.
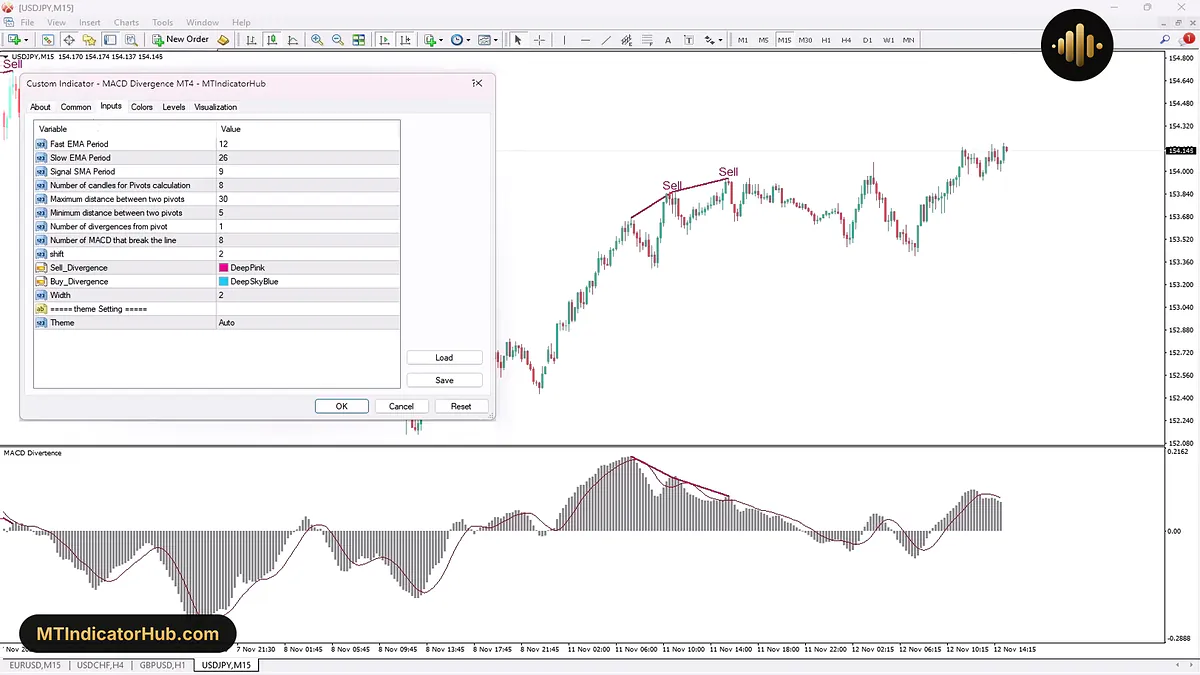
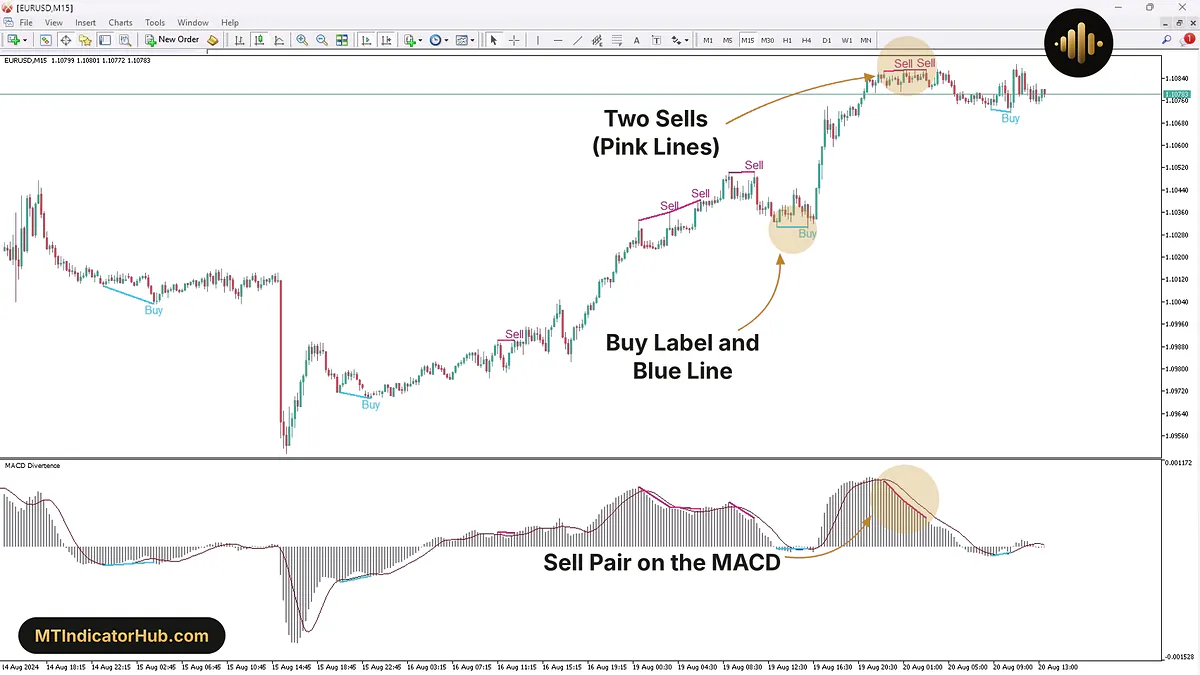
Unlike the MT5 build, this list has no Applied price row, so the price behind the MACD cannot be picked here. Behind the dialog, three rising highs of 11 November 2024 carry two Sell lines end to end: the middle high closes the first pair and opens the second, while the three MACD peaks under them fall in steps.
| Input | Default | What it changes |
|---|---|---|
| Fast EMA Period | 12 | Length of the quicker exponential average inside the MACD |
| Slow EMA Period | 26 | Length of the slower exponential average inside the MACD |
| Signal SMA Period | 9 | Averaging length for the Signal line |
| Number of candles for Pivots calculation | 8 | Candles a high or low must stand out over to count as a pivot |
| Maximum distance between two pivots | 30 | Widest gap, in candles, allowed inside one pair |
| Minimum distance between two pivots | 5 | Narrowest gap, in candles, allowed inside one pair |
| Number of divergences from pivot | 1 | Divergence lines a single pivot may start |
| Number of MACD that break the line | 8 | Grey bars allowed through the histogram line before the pair is skipped |
| shift | 2 | Candles between a pivot and the divergence check |
| Sell_Divergence | DeepPink | Colour used for every bearish drawing |
| Buy_Divergence | DeepSkyBlue | Colour used for every bullish drawing |
| Width | 2 | Thickness of both lines of a drawing |
| theme Setting: header row above the theme choice | ||
| Theme | Auto | Colour theme the indicator uses |
In time, the 8-candle pivot window lasts 40 minutes on M5 and 32 hours on H4, and the 5 to 30 candles between paired pivots become 25 minutes to 2 hours 30 minutes on M5 and 20 to 120 hours on H4.
Conclusion
MACD Divergence MT4 does one comparison, a pivot on the chart against the MACD bar under it, and every pair that passes the distance and crossing tests is drawn as a labelled line in both windows.
The MT4 build has no alert input, so a new line is found only by looking at the chart, and at shift 2 each line appears two candles after its pivot, never on the turning candle.
Your rating
Rate this indicator
How useful was this indicator? Click a star.
FAQ
Frequently asked questions
Not from the Inputs tab. The MetaTrader 4 build offers the three MACD periods, 12, 26 and 9, but no Applied price row, so the price source of the histogram is fixed in this build.
One high can end one pair and start the next. On EURUSD M15, late on 19 August and early on 20 August 2024, three highs edged up while the MACD bars under them kept falling, so the indicator drew a Sell line from the first high to the middle one and a second from the middle high to the third. Number of divergences from pivot, 1 by default, caps how many lines start from one pivot.
That line links the histogram values at the same two pivots, so the disagreement is visible in both windows: across the 4 to 7 October 2024 weekend on USDJPY M15, the price line climbs from 149.003 to 149.124 while the histogram line drops from 0.5315 to 0.1990. If over 8 bars cut through that line, the pair is dropped.
Below zero, a shorter bar is a higher value. On USDJPY M15 on 29 October 2024 the histogram went from -0.0703 at the first low to -0.0682 at the second, while the low dropped from 152.851 to 152.755, so the bars were rising under a falling low and the Buy line was drawn.






Comments
Be the first to comment.