


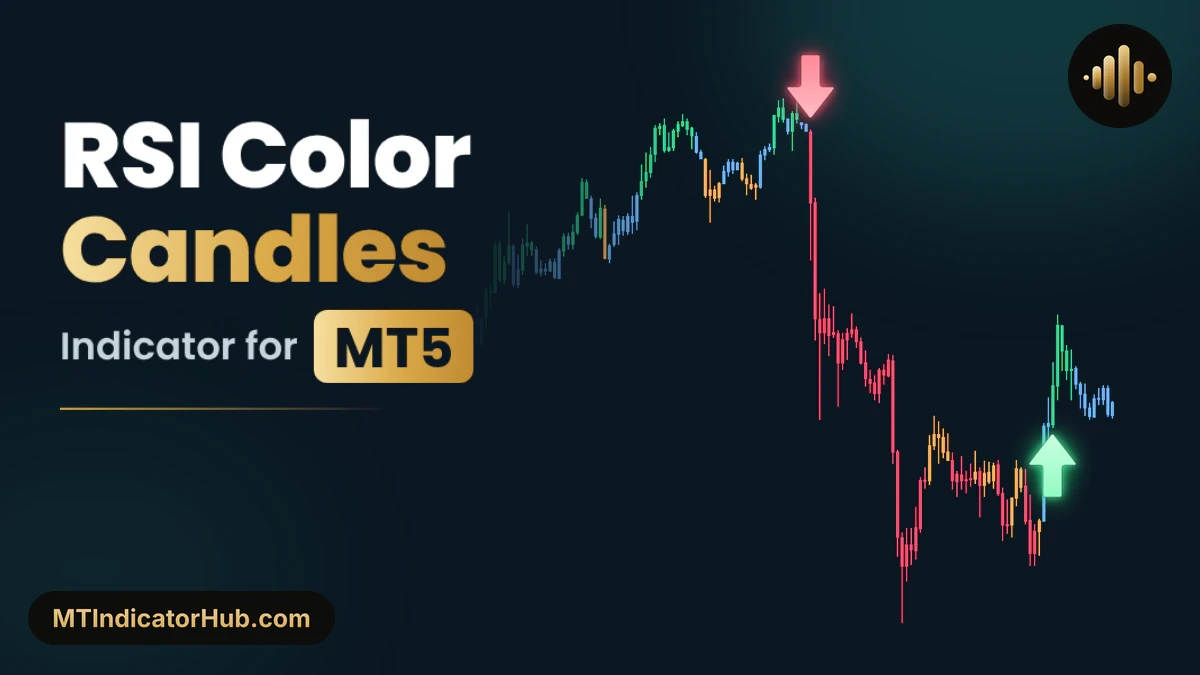
The RSI Color Candles MT5 indicator takes the RSI out of its separate window and puts it on the candles themselves: each candle is painted by its RSI(14) reading, green above 60, blue between 50 and 60, orange between 40 and 50 and red below 40. In the default Breakout mode, a Buy Arrow prints under the first candle that lifts RSI above 60, and a Sell Arrow over the first candle that drops it below 40.
Colours every MT5 candle by its RSI(14) zone and prints a Buy or Sell arrow on the first candle that pushes RSI above 60 or below 40.
RSI Color Candles Specifications
RSI Color Candles Signals MT5 works inside the price chart with no extra window, and it waits for the candle to close before it draws an arrow.
| Item | Details |
|---|---|
| Platform | MetaTrader 5 (MT5); also available for MT4 |
| Categories | Oscillators, Signal & Forecast |
| Indicator type | Trend, Breakout, Entry Exit |
| Skill level | Intermediate |
| Timeframes | Any; shown here on M5 and M15 |
| Trading style | Scalper, Intraday |
| Markets | Forex, Commodities, Indices, Crypto, Stock (shown on XAUUSD) |
| Display | Candles painted green, blue, orange, red or grey by RSI on the price chart; Buy and Sell arrows; info panel with RSI, Market and Signal |
| Alerts | None |
| Version | 1.0 |
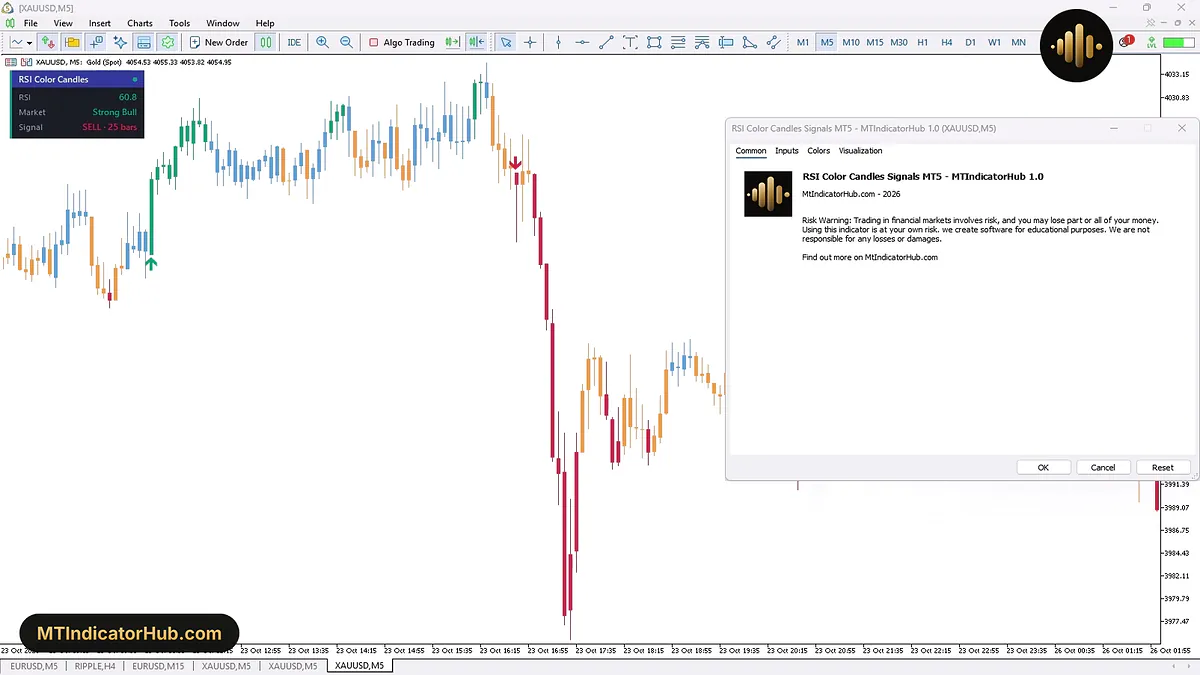
On the XAUUSD M5 chart beside the open Common tab, the info panel reads RSI 60.8, Market Strong Bull and Signal SELL · 25 bars, and the candles change between green, blue, orange and red.
What Is the RSI Color Candles Indicator?
RSI Color Candles puts momentum straight onto the MetaTrader 5 price chart. It calculates the relative strength index with a period of 14 on the close price, and instead of drawing a line in a lower window, it colours every candle by the zone its RSI falls in. Two inputs set the borders: the Upper (strong bull) level at 60 and the Lower (strong bear) level at 40, with 50 as the middle.
- Green: RSI above 60, a strong bullish candle;
- Blue: RSI between 50 and 60, a bullish candle;
- Orange: RSI between 40 and 50, a bearish candle;
- Red: RSI below 40, a strong bearish candle;
- Grey: RSI exactly at 50.
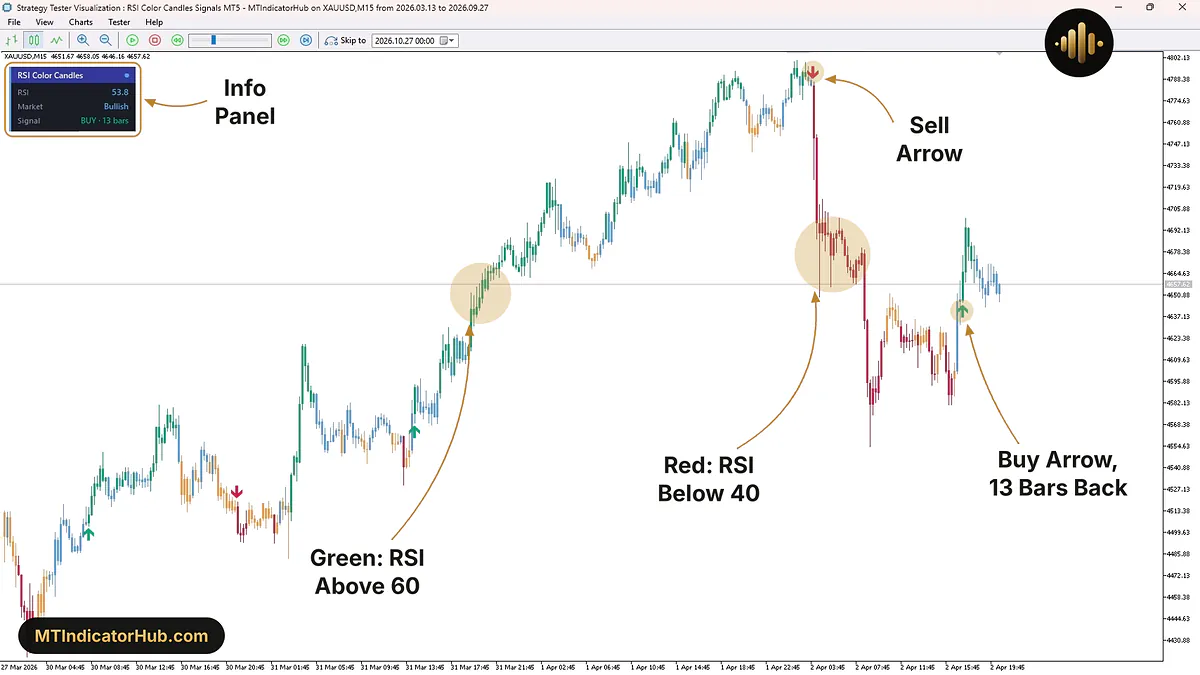
The info panel, titled RSI Color Candles, has three rows of readings. RSI gives the current value, Market names the zone (Strong Bull, Bullish, Bearish or Strong Bear), and Signal shows the side of the last arrow and how many candles have closed since, such as BUY · 13 bars. In the Data Window, the RSI Color Candles RSI row lists the reading of any candle under the pointer, next to the candle's Open, High, Low and Close, and the Buy or Sell row fills in on an arrow candle.
Five arrows take turns between 30 March and 2 April 2026 in the Strategy Tester view below.
Buy Signal
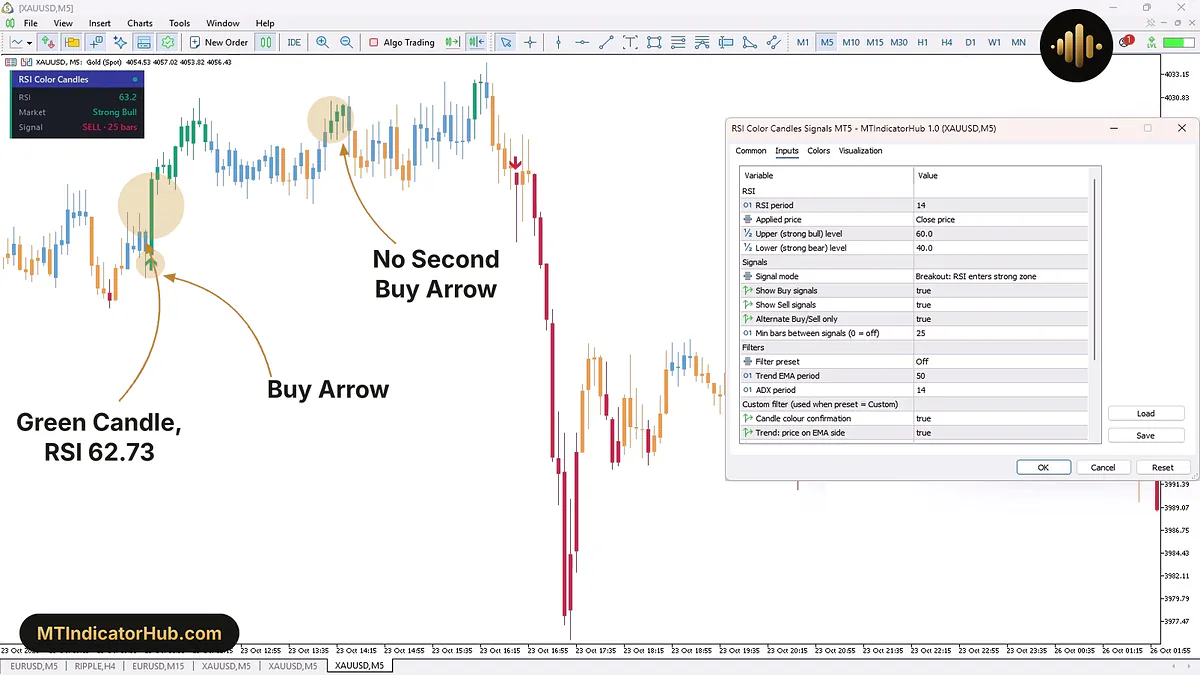
With Signal mode on Breakout: RSI enters strong zone, a Buy Arrow appears when a candle closes with RSI above the Upper (strong bull) level of 60 while the candle before it was still under that level. On the chart this is simply the first green candle after blue or orange ones, and the arrow sits just under its low.
The XAUUSD M5 chart of 23 October 2026 shows it at 11:40. The candles from 11:20 to 11:35 were blue, the last of them at an RSI of 50.24, and the 11:10 candle had read 46.90 in orange. The 11:40 candle opened at 4014.78, closed at 4022.49 and pushed RSI to 62.73, so it turned green and the Buy Arrow was drawn under it; the Data Window's Buy row shows 4014.77, the low of that candle. RSI kept rising to 64.36 at 11:45 and 67.38 at 12:15, and the green run lasted 10 candles, until 12:25. At 12:30 RSI was 59.75 and the candle turned blue.
Two filters decide whether a fresh green candle gets an arrow. Min bars between signals keeps at least 25 candles between arrows, and Alternate Buy/Sell only makes a Buy wait for a Sell before it. At 14:10 the candles turned green again after the blue 14:05 candle, 30 candles after 11:40, so the gap was long enough, yet no second Buy Arrow appeared, because the arrow before it was already a Buy.
For a long trade, the levels come from the arrow candle itself: a buy at the 11:45 open of 4022.49 and a stop under the 4014.77 low, 7.72 lower. The 12:15 candle closed at 4028.42, 5.93 above that buy. Green candles say RSI is still above 60; the first blue one marks the point where the push behind the arrow has eased.
Sell Signal
The Sell Arrow is the mirror case in the colours: the first red candle after orange or blue ones. It means RSI closed below the Lower (strong bear) level of 40, and the arrow is drawn above the candle's high.
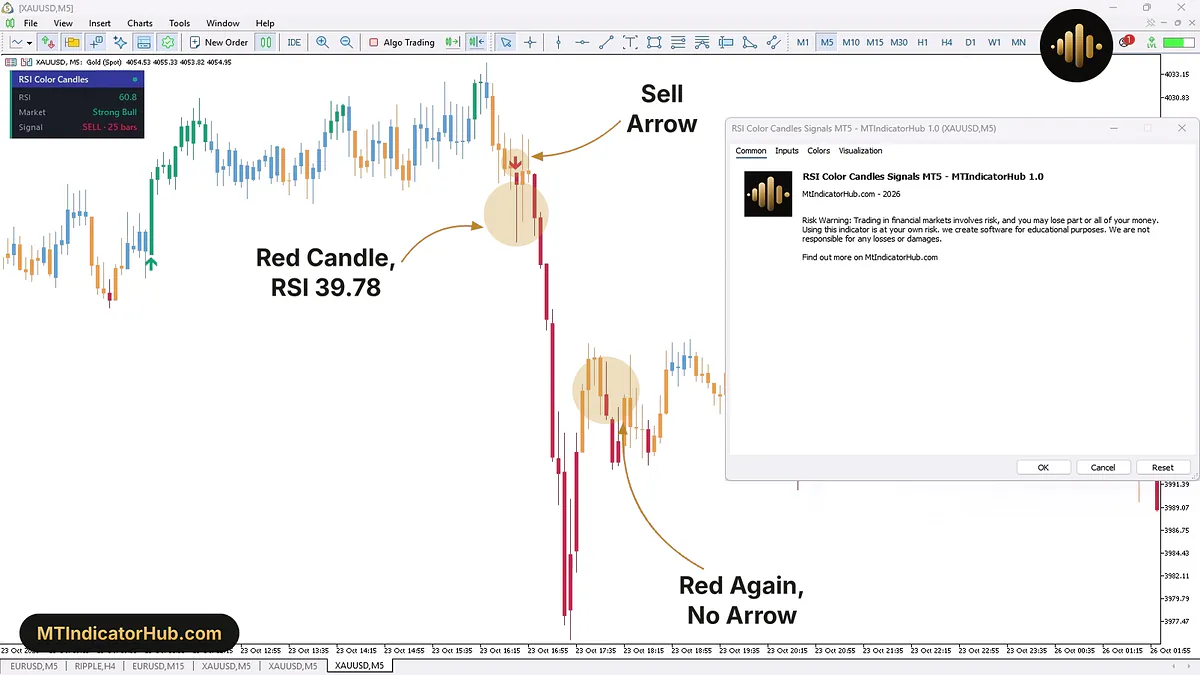
Later on the same day, the 16:35 candle read 42.72 and was orange, as was the 16:40 candle. The 16:45 candle opened at 4023.10, dipped to 4016.12 and closed at 4021.98 with RSI at 39.78, just under the line, so it turned red and the Sell Arrow landed over it. The Data Window's Sell row reads 4023.10, the candle's high. The last arrow before it was the 11:40 Buy, 61 candles earlier, so both filters let it through.
Gold then fell hard. RSI fell to 15.63 at 17:15 and 10.87 at 17:25, and the 17:30 candle reached a low of 3975.59, 46.39 under the 16:45 close, nine candles after the arrow. A short from that close, protected just over the 4023.10 high, would have carried 1.12 of risk.
The same move shows red candles that receive no arrow. At 16:50 and 16:55 RSI climbed back over 40 and the candles were orange, then the 17:00 candle was red again, only three candles after the Sell Arrow. The pattern repeated at 18:00, when red returned after four orange candles. Fifteen candles after the arrow, that was still inside the 25-candle gap, and with Alternate Buy/Sell only on, a Sell cannot follow a Sell anyway.
Indicator Settings
Twenty inputs fill the Inputs tab, sorted under five headers: RSI, Signals, Filters, Custom filter and Panel.
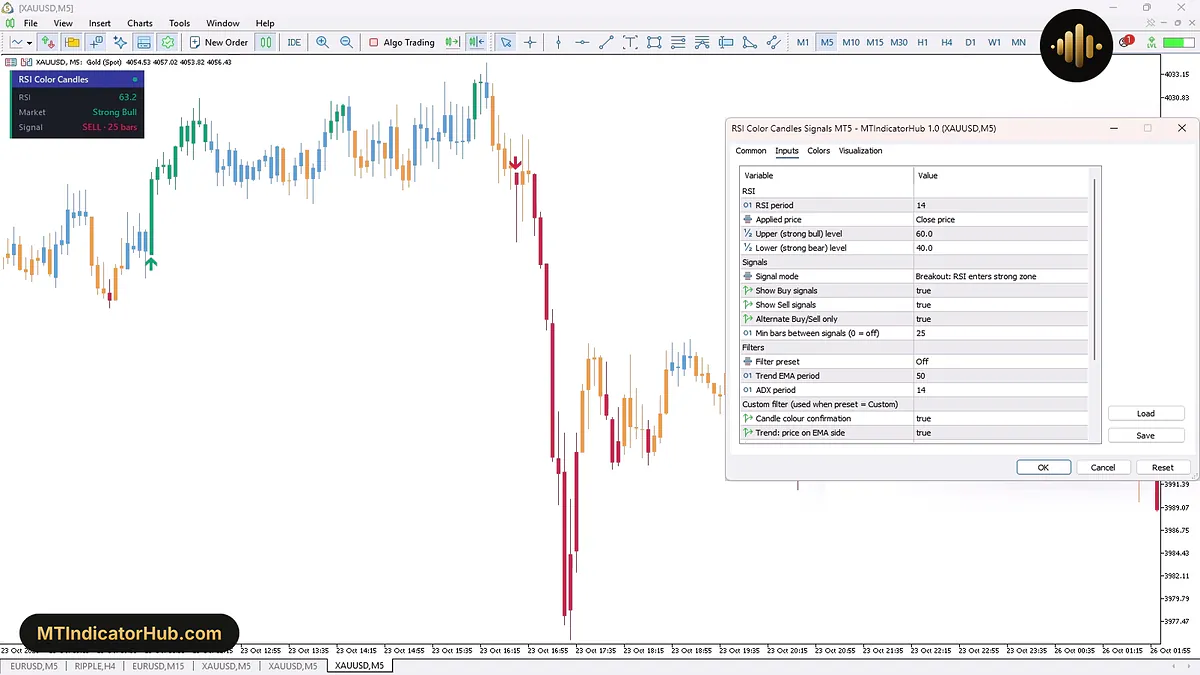
The image shows Filter preset at Off, the setting behind the example charts, so they carry every raw arrow of the Breakout mode; Light, Balanced and Strict thin them out. The rows of the Custom filter group only take effect when Filter preset is Custom (settings below).
| Input | Default | What it changes |
|---|---|---|
| RSI: how the reading and the colour zones are set | ||
| RSI period | 14 | Number of candles in the RSI calculation |
| Applied price | Close price | Price the RSI is calculated on |
| Upper (strong bull) level | 60.0 | RSI value above which candles turn green and the panel shows Strong Bull |
| Lower (strong bear) level | 40.0 | RSI value below which candles turn red and the panel shows Strong Bear |
| Signals: which RSI move prints an arrow and how often | ||
| Signal mode | Breakout: RSI enters strong zone | Which RSI move prints an arrow: entering the strong zones, leaving them, or crossing 50 |
| Show Buy signals | true | Set to false, no Buy Arrow is drawn |
| Show Sell signals | true | Set to false, no Sell Arrow is drawn |
| Alternate Buy/Sell only | true | Arrows alternate between Buy and Sell; a second arrow on the same side is skipped |
| Min bars between signals (0 = off) | 25 | Candles that must close after an arrow before the next one; 0 removes the gap |
| Filters: extra checks on a signal candle | ||
| Filter preset | Balanced | Off, Light, Balanced, Strict, or Custom (settings below) |
| Trend EMA period | 50 | Moving average used for the trend side, slope and distance checks |
| ADX period | 14 | Candles used for the ADX trend strength check |
| Custom filter (used when preset = Custom): the checks chosen by hand | ||
| Candle colour confirmation | true | Buy only on a candle that closes up, Sell only on one that closes down |
| Trend: price on EMA side | true | Buy only with the close above the EMA, Sell only below it |
| Trend: EMA slope must agree | false | Buy only while the EMA rises against its value 3 candles back, Sell only while it falls |
| Chop: require min ADX | true | No arrow while ADX is under Min ADX, treated as a ranging market |
| Min ADX | 15.0 | ADX value the chop check asks for |
| Anti-chase: max distance from EMA | true | No arrow when price has already run too far from the EMA |
| Max distance from EMA (x ATR) | 2.5 | Largest allowed distance from the EMA, in multiples of ATR |
| Panel: the readout in the chart corner | ||
| Show info panel | true | Shows or hides the panel with RSI, Market and Signal |
Each preset is a ready set of these checks. Off takes every raw signal. Light asks for candle colour confirmation and a distance from the EMA of no more than 3 ATR. Balanced adds price on the EMA side and an ADX of at least 15, with the distance limit at 2.5 ATR. Strict adds the EMA slope, raises the ADX floor to 20 and cuts the distance to 2 ATR, so it leaves the fewest arrows. A signal that fails the active checks leaves no trace at all: no arrow, no Buy or Sell value in the Data Window and no change in the panel's Signal row.
On M5, RSI period 14 spans 70 minutes of price and the 25-candle gap 2 hours 5 minutes; on M15 the same gap lasts 6 hours 15 minutes, and Trend EMA period 50 covers 12 hours 30 minutes.
Conclusion
The RSI Color Candles MT5 indicator turns the RSI into candle colours and marks the candle where that reading first moves into a strong zone, above 60 for a Buy Arrow and below 40 for a Sell Arrow in the default mode.
Each arrow waits for the close of its candle, so by the time it shows, part of the move has already happened. With Alternate Buy/Sell only on and a 25-candle gap, a second push into the same zone keeps its colour but gets no arrow. The colours describe RSI and nothing else; the trend, slope and ADX checks only act on arrows, and only when a Filter preset other than Off is chosen. There is no sound or pop-up alert among the 20 inputs, so a new arrow has to be seen on the chart, and the info panel covers the candles in the top left corner unless Show info panel is turned off.
Your rating
Rate this indicator
How useful was this indicator? Click a star.
FAQ
Frequently asked questions
They are RSI zones. A green candle closed with RSI above 60, blue between 50 and 60, orange between 40 and 50 and red below 40, while grey marks a reading of exactly 50. The panel's Market row names the same zones as Strong Bull, Bullish, Bearish and Strong Bear, and moving the two level inputs moves the borders.
A new green run gets an arrow only if two filters allow it. At least 25 candles must have passed since the previous arrow, and while Alternate Buy/Sell only is true, that previous arrow must have been a Sell. On XAUUSD M5 on 23 October 2026 the green candles of 14:10 came 30 candles after the 11:40 Buy Arrow, so only the alternation rule held them back.
They move the trigger. Reversal: RSI leaves OB/OS zone gives a Buy when RSI climbs back out from below 40 and a Sell when it turns back down from above 60. Trend: RSI crosses 50 fires on the midline instead, Buy on a cross above 50 and Sell on a cross below it. The candle colours stay the same in all three modes.
It depends on how many arrows you want to see. Off shows every raw signal and suits studying the tool, Balanced weighs count against quality with the EMA side, ADX 15 and a 2.5 ATR distance, and Strict keeps only signals with a matching EMA slope, ADX 20 or more and a 2 ATR distance. Custom (settings below) lets each of the seven Custom filter rows be switched by hand.






Comments
Be the first to comment.