


The Fractal Support Resistance Levels indicator for MetaTrader 5 turns the latest confirmed swing high into a red Resistance line and the latest confirmed swing low into a green Support line. Each line stays flat until a newer swing replaces it, and a small panel compares the last closed candle with both lines to read the market as Bullish, Bearish or Ranging.
Marks the latest confirmed swing high and swing low as red and green step lines on MT5, with a panel that reads the market as Bullish, Bearish or Ranging.
Fractal Support Resistance Levels Specifications
Everything is drawn on the price chart itself, and with the default sensitivity the indicator starts working once the chart holds eight bars.
| Specification | Detail |
|---|---|
| Platform | MetaTrader 5 (MT5); also available for MT4 |
| Categories | Support & Resistance, Price Action |
| Indicator type | Levels, trend and range state |
| Skill level | Beginner |
| Timeframes | Any; shown here on M15 |
| Trading style | Intraday, swing trading |
| Markets | Forex, gold, indices, crypto, stocks |
| Display | Two step lines on the price chart (red Resistance, green Support) and a three-row panel in the chart's top-left area |
| Alerts | None |
| Version | 1.0 |
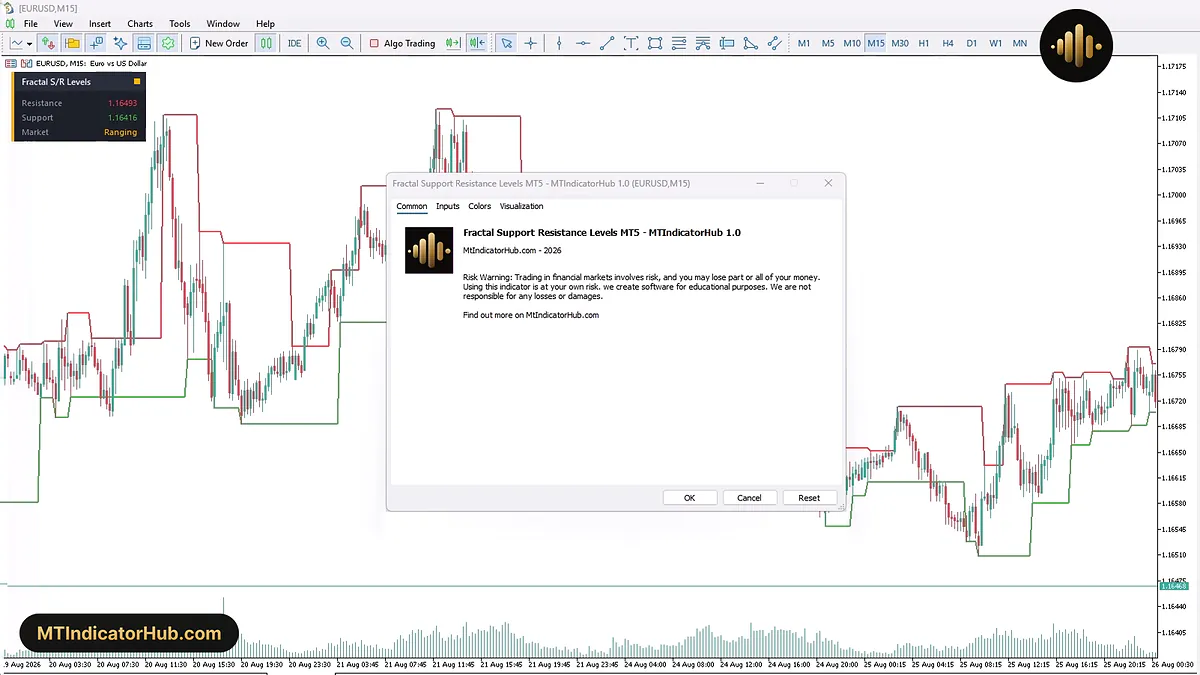
With the Common tab open, the EURUSD M15 panel still holds Resistance at 1.16493 and Support at 1.16416, and the last close between them reads Ranging.
What Is the Fractal Support Resistance Levels Indicator?
A fractal, in this tool, is a candle whose high stands above the three candles on each side of it, or whose low sits below the three on each side. Set the sensitivity to 2 and the shape becomes the familiar five-candle fractal of Bill Williams; the default of 3 asks for seven candles, so minor wiggles are skipped.
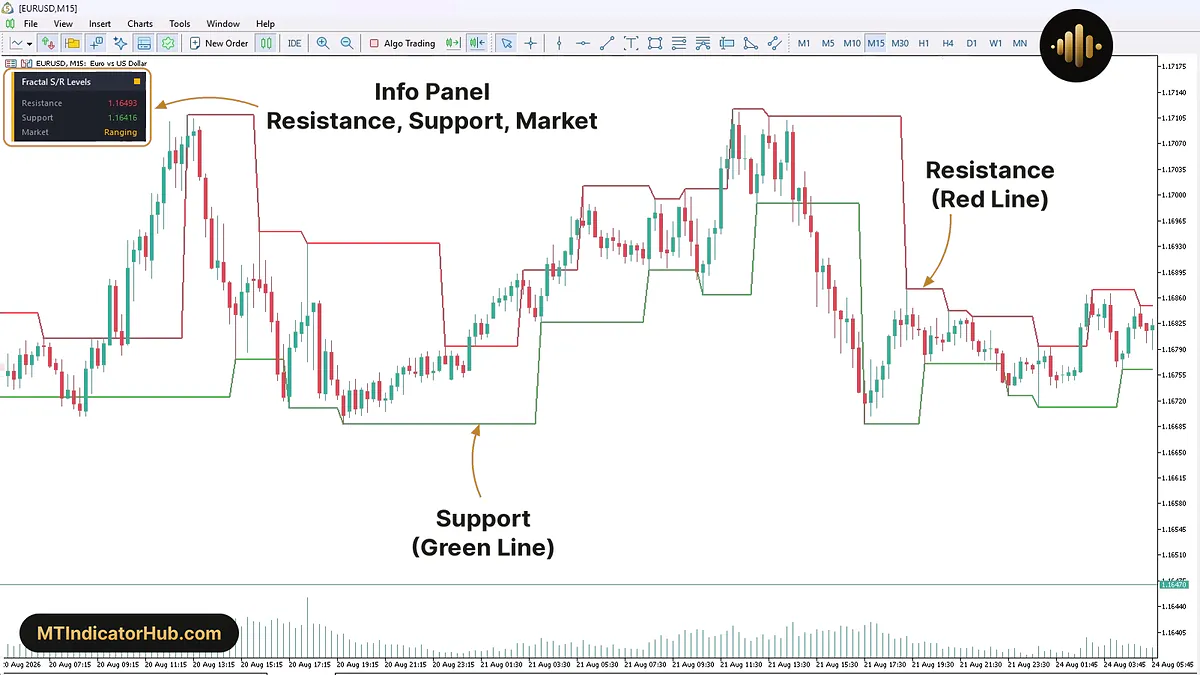
The newest swing high becomes the red Resistance line and the newest swing low the green Support line. A level holds its price, bar after bar, until a fresher swing of the same kind appears, and then the line jumps to it. That is why both lines look like staircases: each flat step is one support or resistance level that price has not yet replaced.
The dark panel titled Fractal S/R Levels has three rows. Resistance and Support print the two current prices in their line colours. Market reads Bullish in green when the last closed candle finished above resistance, Bearish in red when it finished below support, and Ranging in amber for anything in between; the coloured strip on the panel's left edge and the dot in its header change with it.
Indicator in an Uptrend
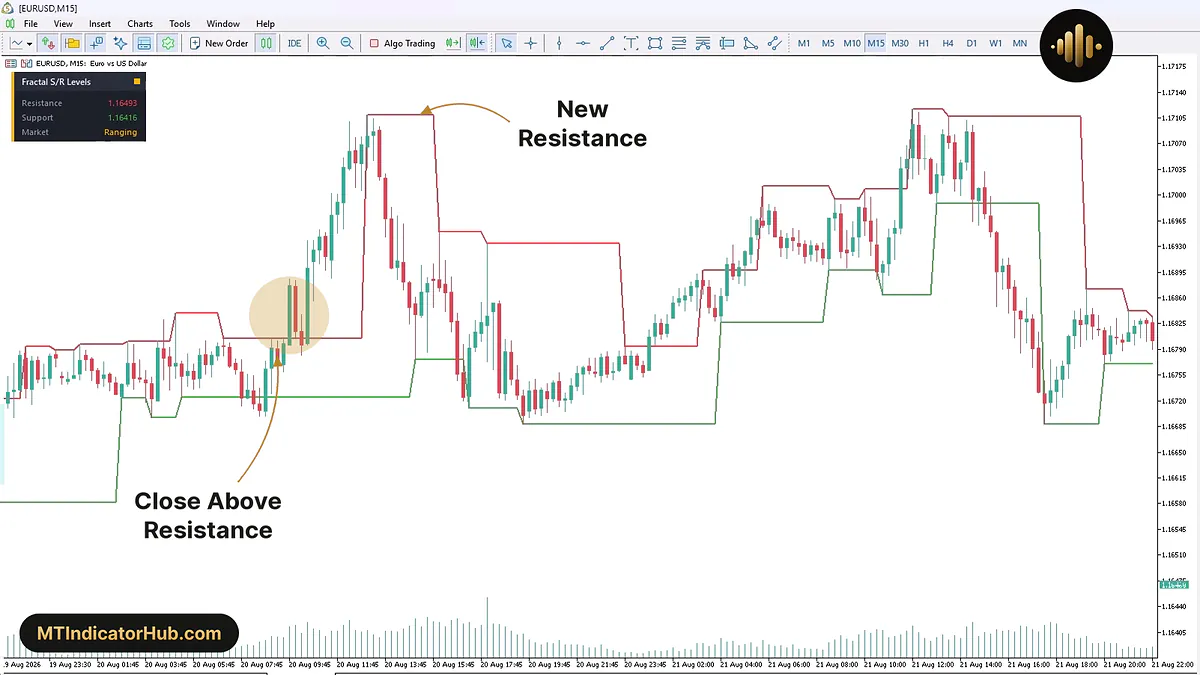
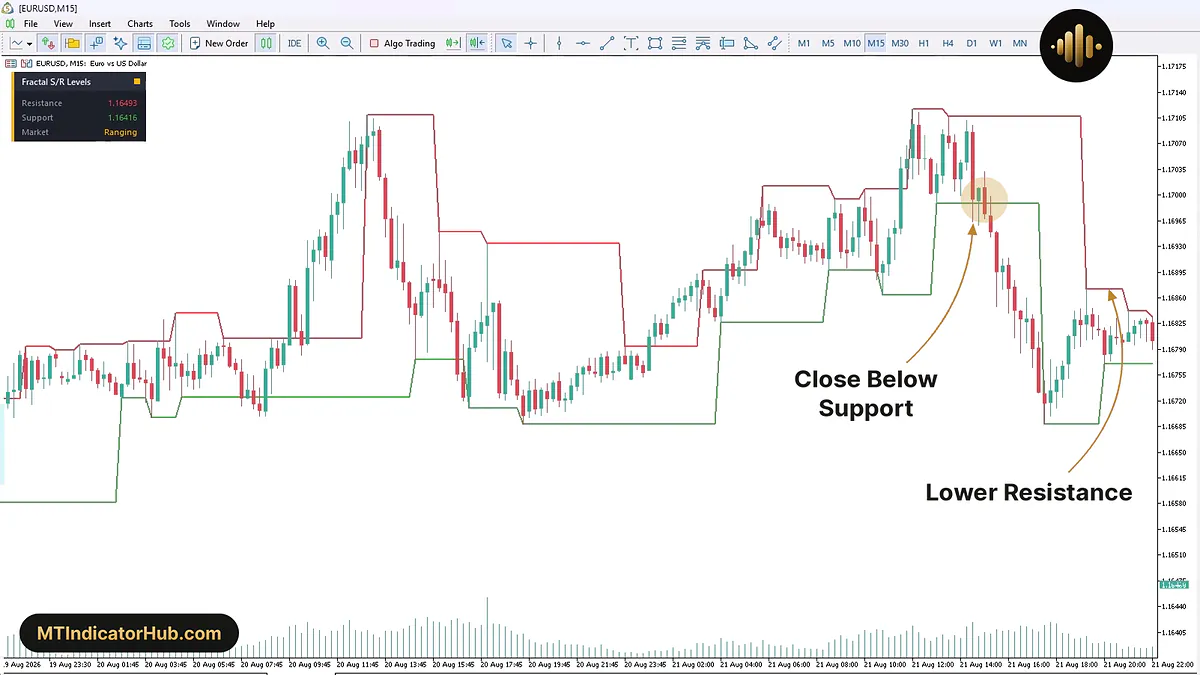
A rising market keeps printing higher swing lows, so the green Support line climbs in steps behind price, while the red line marks the last swing high still standing in the way. The moment a candle closes above that red step, Market switches to Bullish and the strip and dot turn green.
Scrolled back to 20 Aug on EURUSD M15, the 09:45 candle closed near 1.16876, about 7 pips above the red step at 1.16805. The red line did not follow price up: it held 1.16805 while the rally climbed close to 1.17108, and only stepped up to that price once the top was confirmed as a new swing high.
For a long position, the green step below price is the structural stop reference, since a close under it would turn the reading Bearish; at the breakout it sat near 1.16725, about 15 pips under the close. A slip back under the red line without reaching support returns the panel to Ranging.
Indicator in a Downtrend
Falling prices work the other way round: each lower swing high pulls the red line down a step, and the green line holds the last low that sellers have to break. A close beneath that green step sets the panel to Bearish, painted red.
The panel judges closed candles only. On 21 Aug, the 14:30 candle ended at 1.16995, a fraction above the green step at 1.16989, so the reading did not change. The 15:00 candle closed near 1.16976, about a pip under the line, and that close is what turns the Market row Bearish; the next two finished near 1.16950 and 1.16897. Resistance held at 1.17108, some 13 pips over the break, which is where a short would keep its stop until the red step came down to 1.16872 at the next lower high.
Indicator Settings
The MT5 Inputs tab holds five inputs in a single list.
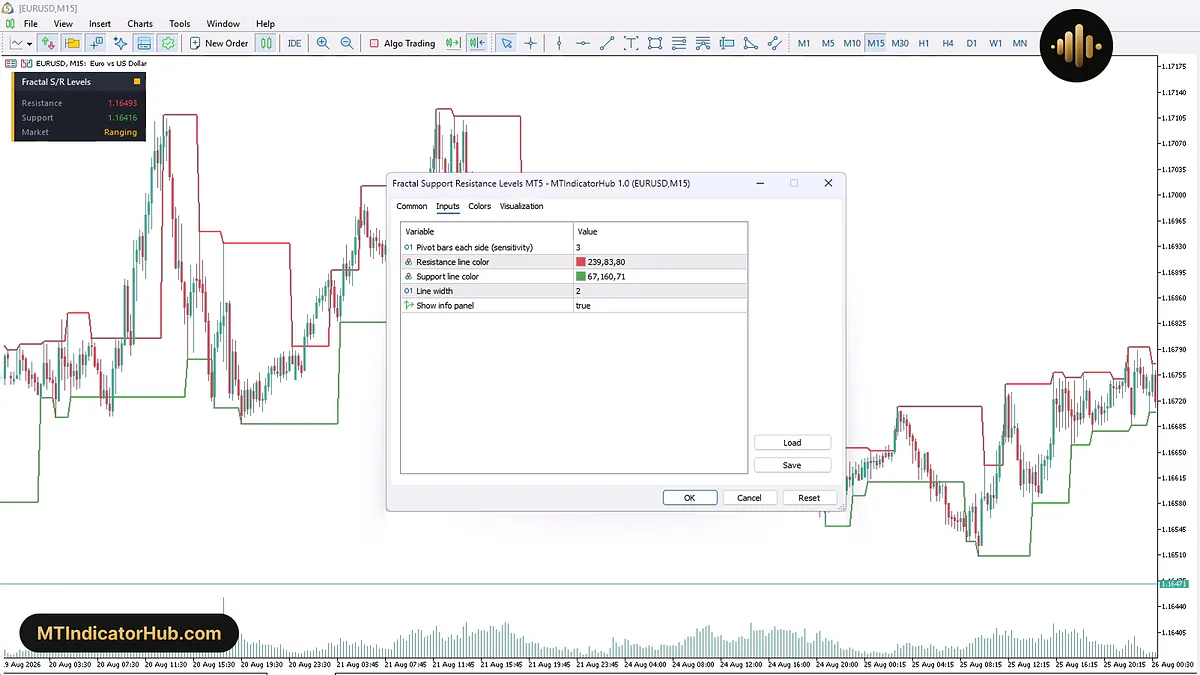
Pivot bars each side is the one input that moves the lines. The two colours and the width only restyle them, and the last input shows or hides the panel.
| Input | Default | What it changes |
|---|---|---|
| Pivot bars each side (sensitivity) | 3 | Candles required on each side of a swing; higher finds fewer, larger levels later, lower finds more levels sooner (minimum 1) |
| Resistance line color | 239,83,80 | Colour of the red Resistance line and of its price on the panel |
| Support line color | 67,160,71 | Colour of the green Support line and of its price on the panel |
| Line width | 2 | Thickness of both step lines |
| Show info panel | true | Draws or removes the Fractal S/R Levels panel |
With the default of 3, a swing spans seven candles, which is 1 hour 45 minutes of price on M15. Its level appears three candles after the swing candle: 45 minutes later on M15 and 15 minutes later on M5.
Conclusion
This indicator does one job: it keeps the latest confirmed swing high and swing low on the chart as two lines and says, from the last closed candle, whether price is above, below or between them.
The cost of confirmation is delay, since a new step only shows up three candles after its swing, so in a fast move the line can trail price. Only the newest swing of each kind is active; older levels remain in the staircase but no longer count for the panel, and the indicator does not rank how strong a level is. A single close beyond a line flips the Market row, which can happen back and forth in a choppy range. Arrows and alerts are not part of the tool, and because the panel cannot be moved from the upper left of the chart, it may hide some candles there.
Your rating
Rate this indicator
How useful was this indicator? Click a star.
FAQ
Frequently asked questions
It waits for a swing: a candle whose high tops the three candles on either side becomes the new resistance, and a candle whose low undercuts the three on either side becomes the new support. The level keeps that candle's price until the next swing of the same kind.
The Market row compares the levels with the close of the last finished candle, not with the live price. A forming candle that climbs back over support changes nothing until it closes there; then the reading moves to Ranging.
A higher number asks a swing to stand out against more candles, so the lines move less often and mark larger turning points, but each new level appears later. A lower number, down to the minimum of 1, catches small swings almost at once and makes the steps more frequent.
Whenever the last closed candle finished at or between the two lines. On the EURUSD M15 chart above, that band ran from 1.16416 to 1.16493, and the panel, its left strip and its dot were all amber.
Yes. Setting Show info panel to false removes the panel, and the red and green lines keep working as before. With the panel on, it sits in the top-left corner of the chart and cannot be moved.






Comments
Be the first to comment.