Free MT5 Support & Resistance Indicators
Every Support & Resistance indicator on MetaTrader 5 starts from the same evidence: prices where the market has already turned. Support marks a floor that held a decline, resistance a ceiling that capped a rally, and price tends to react near them again until a decisive close breaks through, most visibly at psychological round numbers.
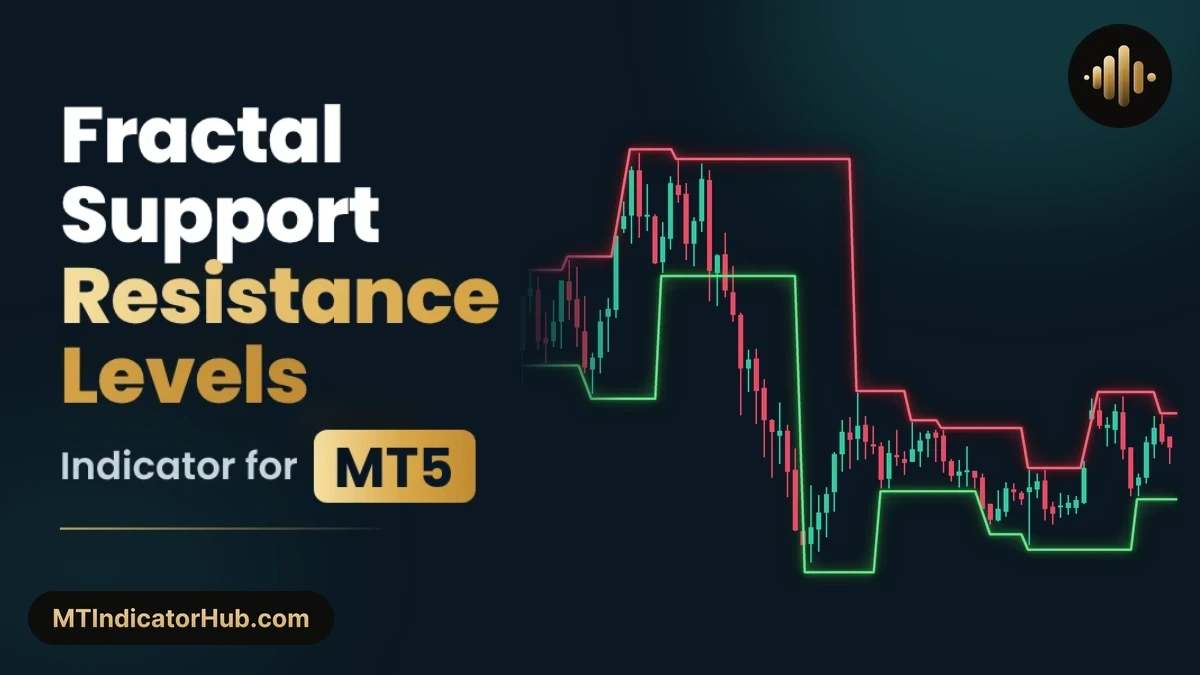
Each tool here decides which turning points count as a level and when a level stops counting. Fractal and swing tools draw a step line from the last confirmed high and low. Zone finders shade the band where repeated touches pile up, while others mark the prior week's high and low or the Fibonacci levels between two swings. Automatic versions update with every new swing, multi-timeframe ones bring daily or weekly levels down to M15, and dynamic support follows an exponential moving average, a trendline or a channel that slopes with the trend.
Touch count and timeframe give a level its weight in technical analysis: a D1 line tested three times outranks a fresh M5 swing. Ranging markets respect these levels, while news spikes and strong trends slice through them. A spike past a line that closes back inside is a fakeout, and a former ceiling that price closes above is often retested as a floor. Inside a range, traders buy near support and sell near resistance, with protective stops outside the band. Compiled from MQL5 into .ex5 files, these free MT5 tools draw on the main chart beside the candles that test each level; every indicator page carries the full installation guide. Stock and futures traders on MT5 can weigh a breakout against real exchange volume, since a close through a level on heavy volume carries more conviction than one on thin trading.