


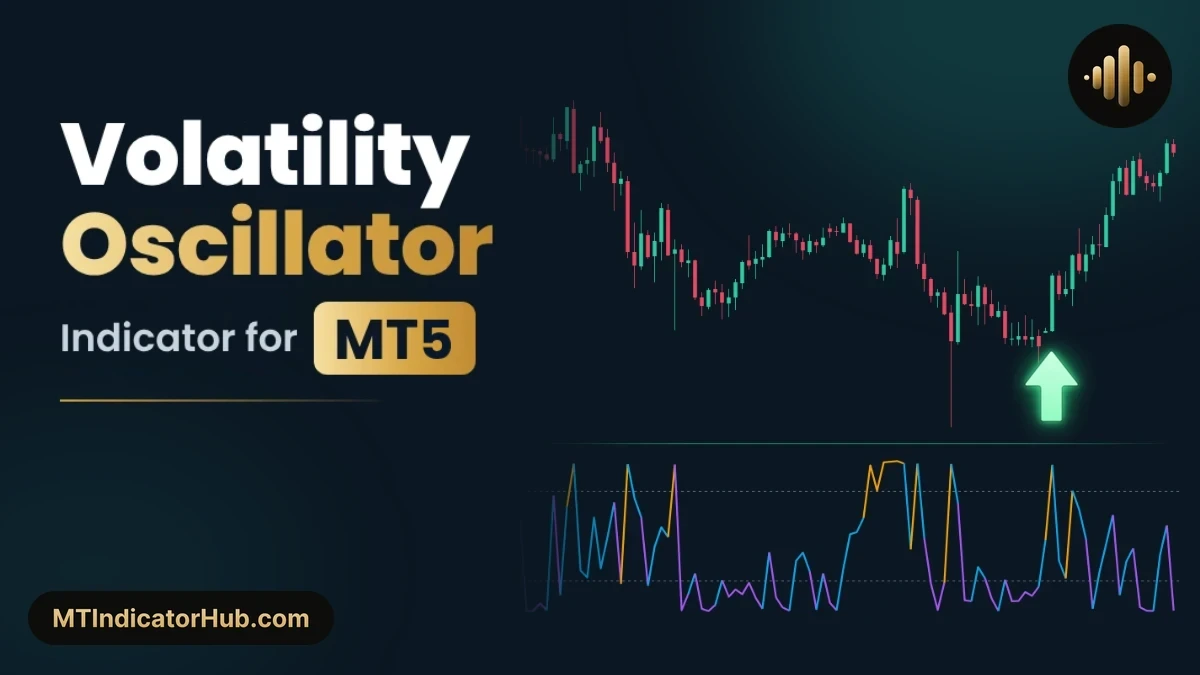
The Volatility Oscillator for MetaTrader 5 ranks the size of each candle against the last 14 bars on a 0 to 100 scale. A quiet stretch of small candles pushes the line to 20 or below, the purple squeeze zone, and the first large candle that follows lifts it to 80 or above, into amber expansion.
Ranks each candle's size against the last 14 bars from 0 to 100 and marks squeeze-to-expansion breakouts with buy and sell arrows on closed bars.
Volatility Oscillator Specifications
The indicator measures candle size only, needs at least the lookback period plus two bars of history, and places arrows on closed bars only.
| Specification | Detail |
|---|---|
| Platform | MetaTrader 5 (MT5); also available for MT4 |
| Categories | Volatility, Oscillators, Breakout |
| Indicator type | Breakout, entry and exit |
| Skill level | Intermediate |
| Timeframes | M15 to M30, H1 to H4 |
| Trading style | Intraday, day trading, swing trading |
| Markets | Forex, crypto, stocks, indices, commodities |
| Display | Three-colour oscillator in a separate window (readings 0 to 100, window scale −8 to 108); arrows and info panel on the price chart |
| Alerts | None |
| Version | 1.0 |
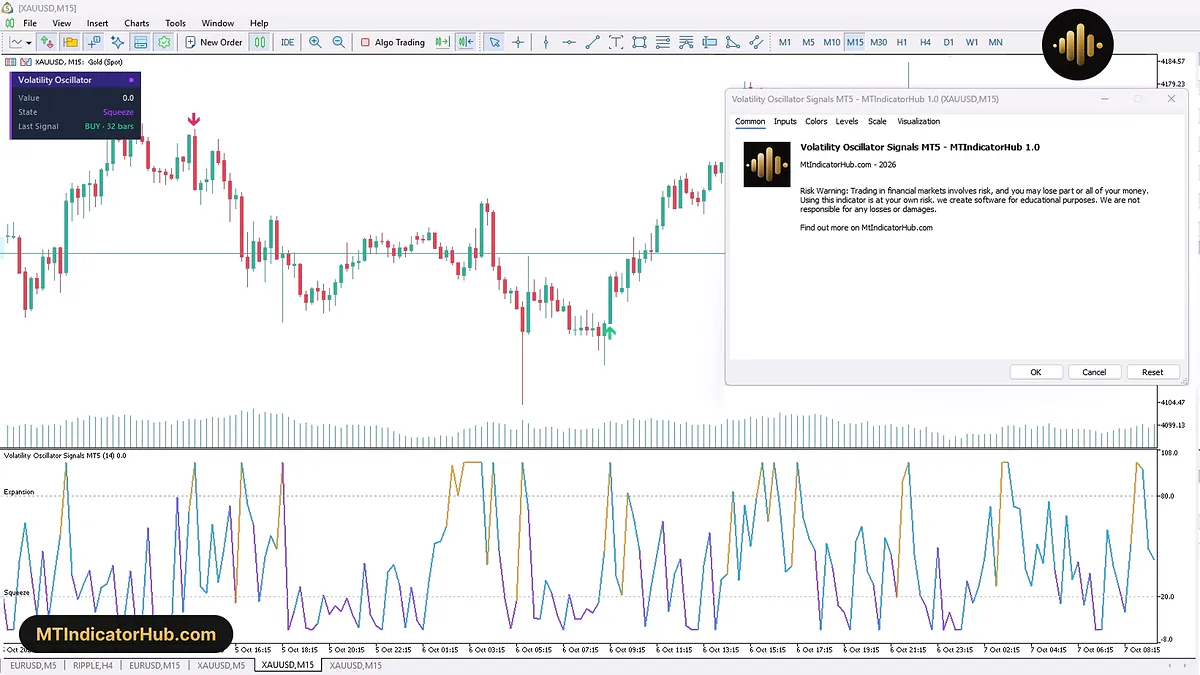
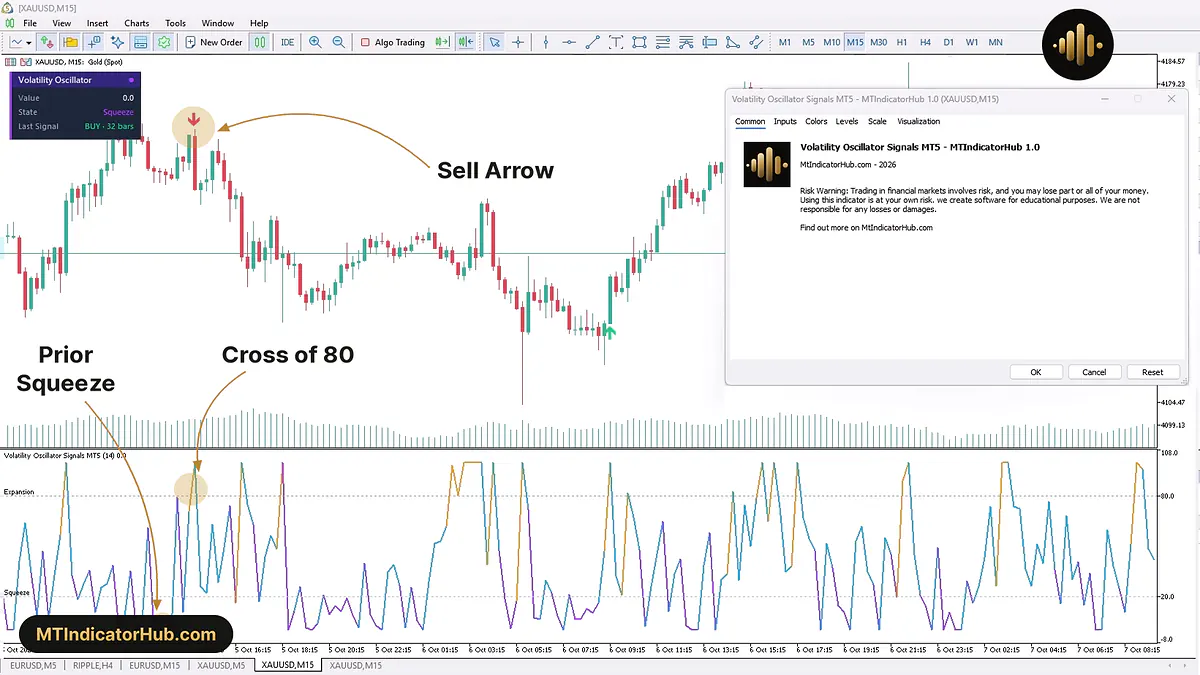
Behind the Common tab, the panel on XAUUSD M15 reads 0.0 and Squeeze, the lowest possible reading, with the last buy arrow 32 bars back.
What Is the Volatility Oscillator Indicator?
The Volatility Oscillator compares the size of the newest candle with the candles of the last 14 bars, the newest one included, and turns that comparison into a reading from 0 to 100. A reading near 0 means the newest candle is among the smallest of the group; a reading near 100 means it is among the largest.
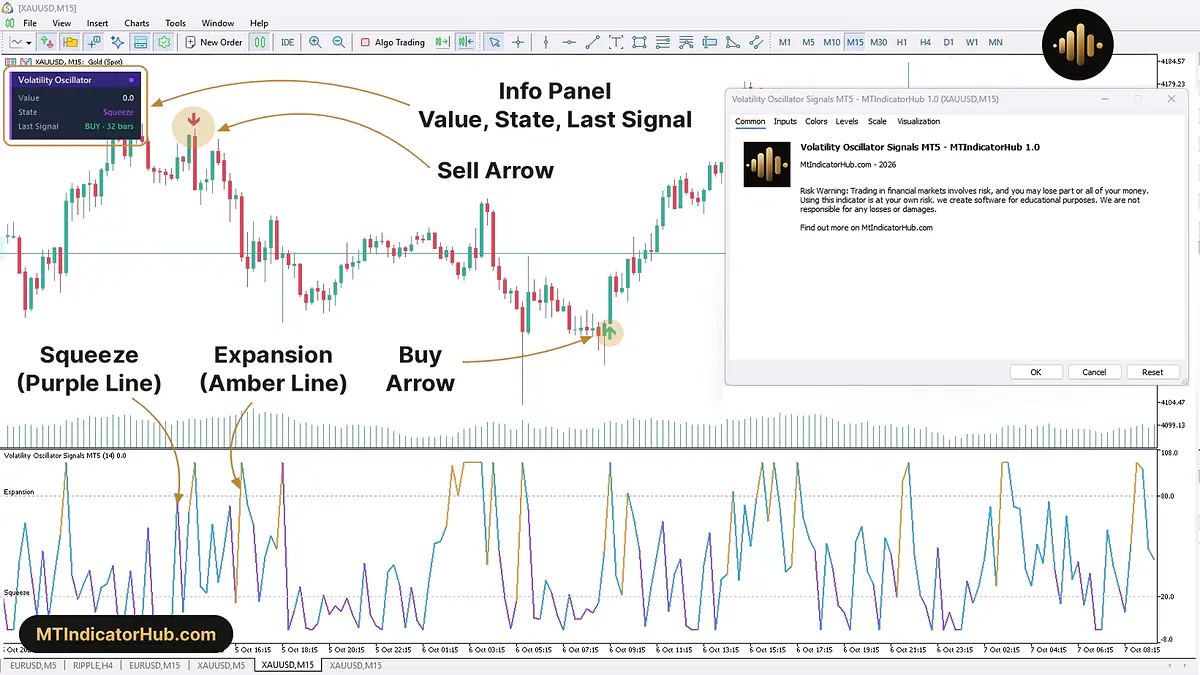
Two dotted slate lines split the window into three states. At or above the Expansion level of 80, the line turns amber: the candle is among the biggest of the lookback and volatility is opening up. At or below the Squeeze level of 20, the line turns purple: candles have shrunk and the market is coiling. Anything in between draws in sky blue as the Normal state.
On the price chart, a dark panel in the top-left corner repeats the story in three rows: Value (the current reading), State (Normal, Expansion or Squeeze) and Last Signal, which shows BUY or SELL with the number of bars since that arrow, or None.
Buy Signal
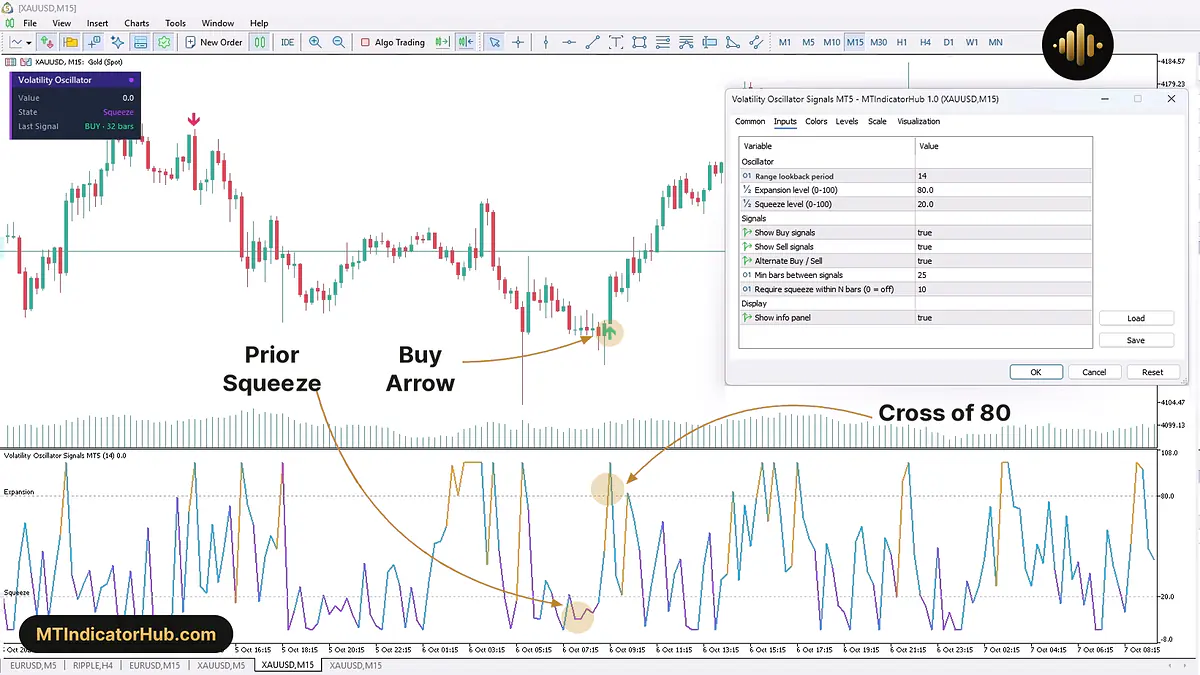
A buy arrow marks a volatility breakout in the bullish direction. The setup starts with a quiet phase, when the line has dipped into the purple squeeze zone within the previous 10 bars; then a large bullish candle lifts the line up through the Expansion level of 80. The arrow is placed once that candle has closed.
When this happens, a green up arrow appears under the candle's low and the panel switches to BUY · 0 bars. With Alternate Buy / Sell on and both sides shown, a buy only follows a sell, and Min bars between signals keeps at least 25 bars between two arrows.
Traded as a long entry, the earliest fill is the open of the next bar, with the stop below the low of the signal candle. The exit can follow a fixed multiple of that risk or wait for the line to drop back into the purple squeeze zone, which marks the end of the volatility cycle that produced the arrow.
Sell Signal
The sell arrow comes from the same event: the oscillator still has to rise through 80, because it measures candle size, not direction. The candle decides the side. If the large breakout candle is bearish, a red down arrow is drawn above its high and the panel shows SELL. As a short entry, the matching stop sits above the high of the signal candle.
The squeeze requirement is what separates these arrows from ordinary large candles. Require squeeze within N bars, set to 10, looks back for a purple reading before the expansion candle; a wide candle in an already active market fails that test and prints nothing. Setting the input to 0 removes the filter.
Indicator Settings
The MT5 inputs window groups the settings under Oscillator, Signals and Display.
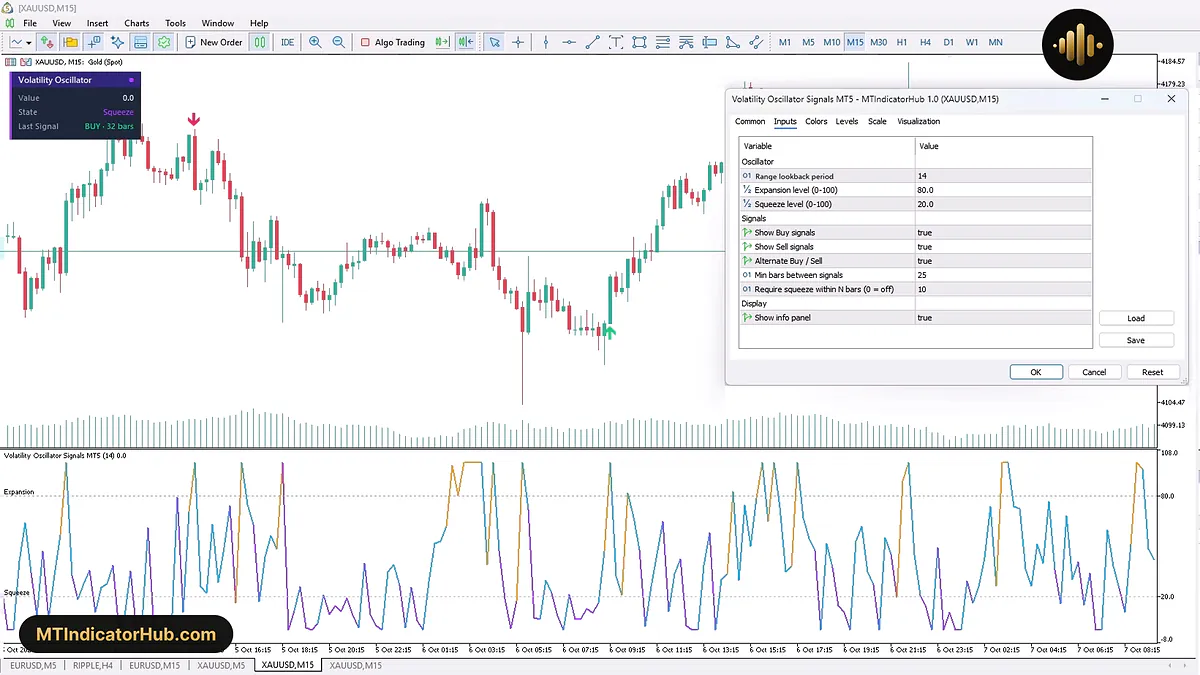
Range lookback period shapes the line itself, while the two levels set where it changes colour and where the Expansion and Squeeze dotted lines sit. The five Signals inputs only filter which arrows are drawn.
| Input | Default | What it changes |
|---|---|---|
| Oscillator: how the line is calculated and coloured | ||
| Range lookback period | 14 | Number of bars the current candle size is ranked against (minimum 2) |
| Expansion level (0-100) | 80 | Level the line must cross upward to trigger an arrow; limited to 1 to 100 |
| Squeeze level (0-100) | 20 | Level that defines the squeeze; kept at least one point below Expansion |
| Signals: when an arrow is drawn | ||
| Show Buy signals | true | Draws the green up arrows |
| Show Sell signals | true | Draws the red down arrows |
| Alternate Buy / Sell | true | Allows only an arrow opposite to the last one (when both sides are shown) |
| Min bars between signals | 25 | Minimum bars between two arrows |
| Require squeeze within N bars (0 = off) | 10 | How many earlier bars are checked for a squeeze reading |
| Display: what appears on the price chart | ||
| Show info panel | true | Shows or hides the Value, State and Last Signal panel |
Conclusion
Ranking candle size rather than price gives this oscillator a narrow and clear task: catching the bar where a quiet market suddenly widens, and taking that bar's close as the direction.
Gaps between candles are not counted as candle size, and the direction rests on a single candle, which can mislead when expansion bars alternate in a choppy market. Because the arrow filters depend on the arrows that came before, two charts with different history can show slightly different arrows. There are no alerts, and the panel stays in the top-left corner where it can cover price.
Your rating
Rate this indicator
How useful was this indicator? Click a star.
FAQ
Frequently asked questions
The reading answers one question: how big is this candle within the last 14 bars, itself included? A value close to 100 marks one of the widest candles of that stretch, a value close to 0 one of the narrowest. At 80 or higher the line is drawn amber, at 20 or lower purple, and in between sky blue.
The line measures how large the candle is, not which way it moved. A big bearish candle and a big bullish candle both push it up through 80; a bearish close is what turns that expansion into a sell arrow.
It makes an arrow wait for a squeeze reading, 20 or lower, in the previous N bars, 10 by default. This keeps arrows to breakouts that follow a quiet phase. Setting it to 0 turns the check off.
Both filters look back at earlier arrows: Min bars between signals counts the bars since the last one, and Alternate Buy / Sell checks its direction. If one chart has loaded more history than another, its first arrow can fall on a different bar, and that difference can carry forward to a few later arrows.






Comments
Be the first to comment.