


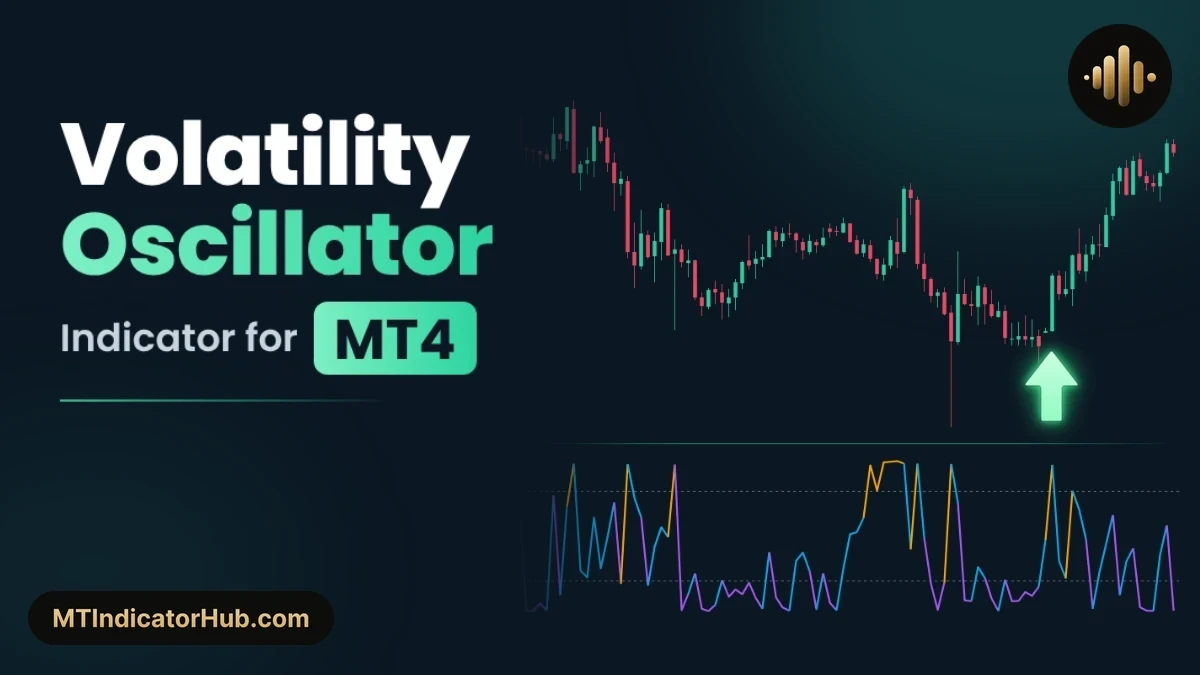
On MetaTrader 4, the Volatility Oscillator gives every candle a value from 0 to 100 that depends on how big it is next to the 14 bars of its lookback. Quiet runs of small candles sink that value into a purple squeeze at 20 or lower, and the first wide candle to break the calm sends it up into amber expansion at 80 or higher.
Gives each MT4 candle a 0 to 100 value from its size among the 14 most recent bars, with arrows when a quiet squeeze breaks into expansion.
Volatility Oscillator Specifications
Only candle size feeds the reading. The calculation begins once the chart holds two bars more than the lookback period, and no arrow is printed until its candle has closed.
| Specification | Detail |
|---|---|
| Platform | MetaTrader 4 (MT4); an MT5 version is available too |
| Categories | Volatility, Oscillators, Breakout |
| Indicator type | Breakout, entry and exit |
| Skill level | Intermediate |
| Timeframes | M15 to M30, H1 to H4 |
| Trading style | Intraday, day trading, swing trading |
| Markets | Forex, crypto, stocks, indices, commodities |
| Display | Own window with a line in three colours (values 0 to 100 inside a −8 to 108 range); signal arrows and a three-row panel over the candles |
| Alerts | None |
| Version | 1.0 |
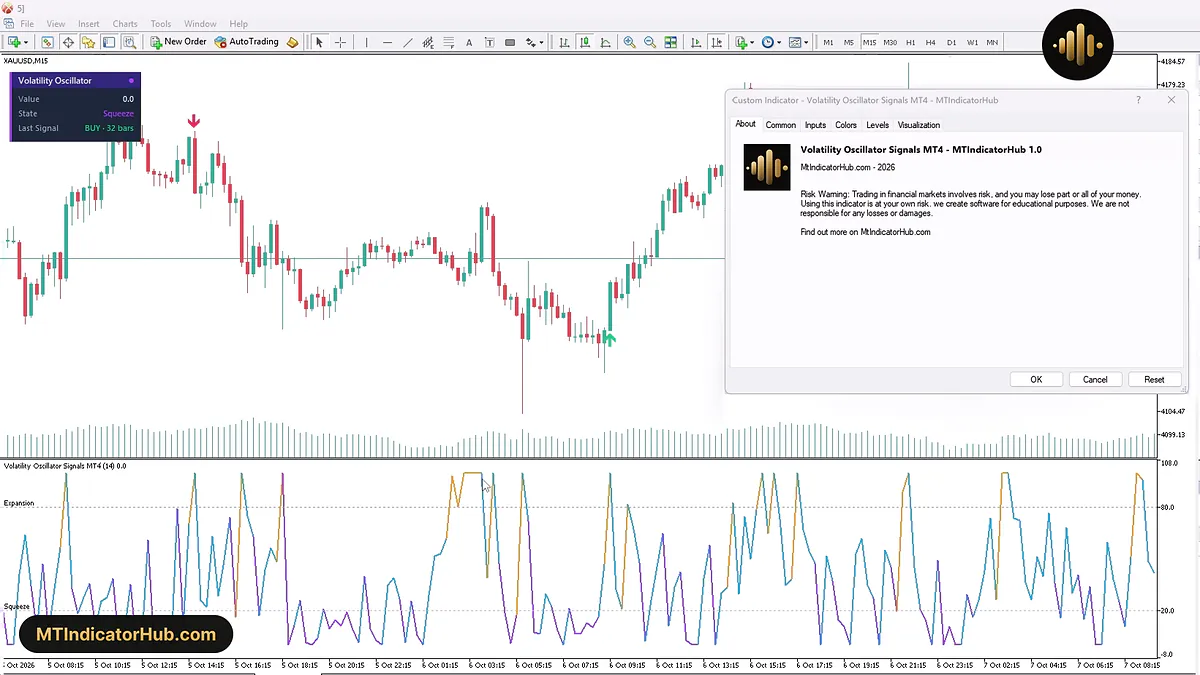
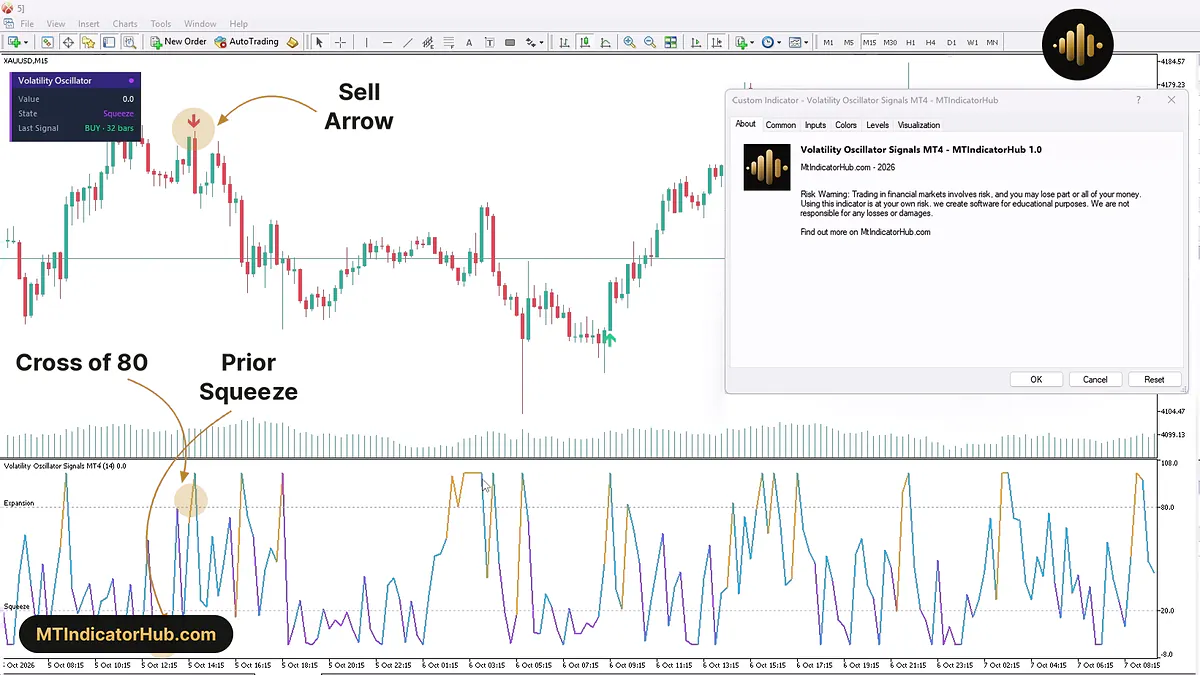
On XAUUSD M15, the panel peeking out from behind the About tab gives a value of 0.0 in the Squeeze state, as low as the reading can go, and dates the most recent buy arrow to 32 bars earlier.
What Is the Volatility Oscillator Indicator?
Every new candle is measured against a lookback group of 14 bars, and the new candle is itself a member of that group. Its place in the group becomes the reading: near 0 when it ranks with the smallest candles, near 100 when it ranks with the biggest. On MT4, the label at the top of the indicator window reads Volatility Oscillator Signals MT4 (14), the number being that lookback.
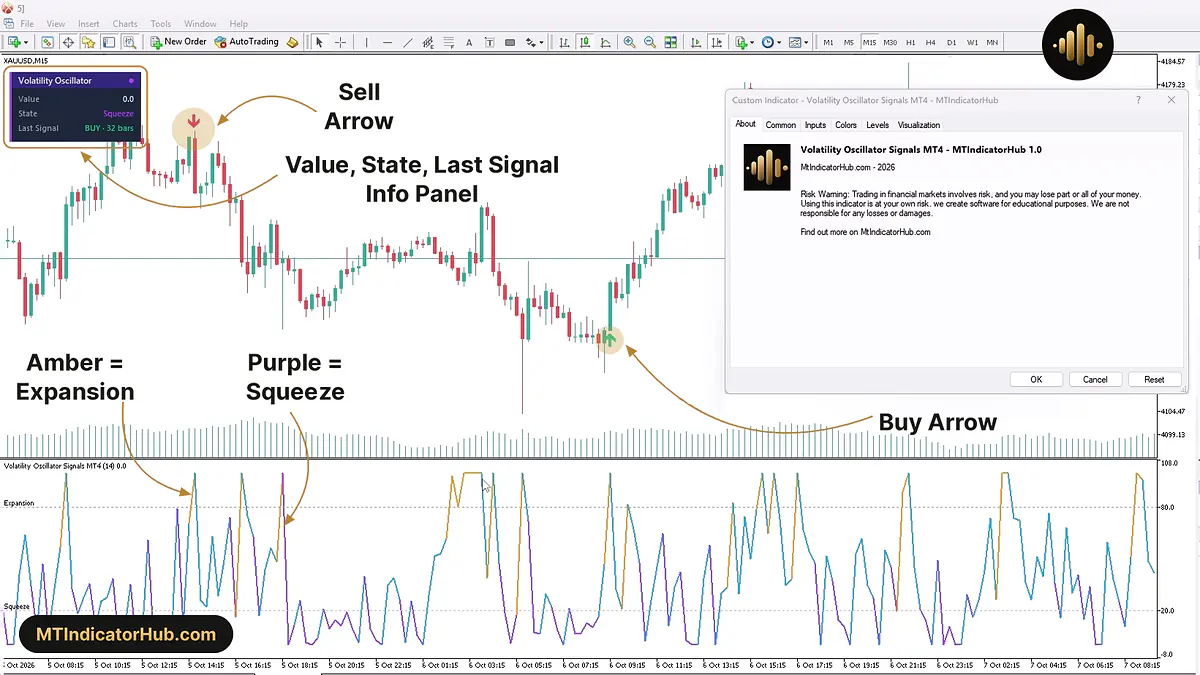
A pair of dotted slate lines divides the indicator window into three zones. At 80, the Expansion level, and anywhere above it, the line is amber: this candle ranks with the widest in the lookback, so volatility is widening. At 20, the Squeeze level, and anywhere below it, the line is purple, since candles have contracted while the market winds up. Between the two levels, sky blue marks the Normal state.
A dark panel at the top left of the price chart sums all of this up. Its Value row holds the latest reading, its State row tells whether the market is in Squeeze, Normal or Expansion, and its Last Signal row gives the direction of the newest arrow with a count of bars since it appeared, or None before the first one.
Buy Signal
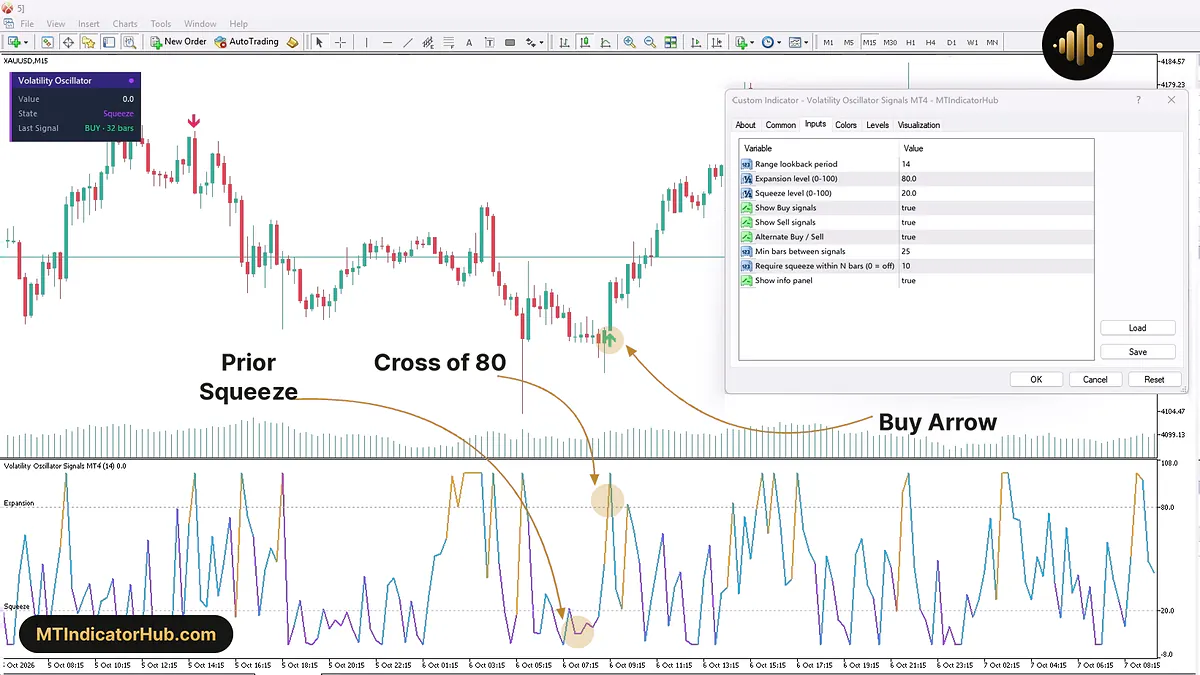
Buy arrows belong to bullish volatility breakouts, and every one of them starts with a calm market. At some point in the 10 bars leading up to the signal, the line must have dipped into purple. After that, a large bullish bar drives the reading up past 80, the Expansion level, and the arrow is drawn only once that bar is closed.
A green arrow then points up from under the bar's low, while BUY · 0 bars appears on the panel. Two filters keep arrows apart. Min bars between signals demands a gap of 25 bars or more, and Alternate Buy / Sell, when it is on and both directions are enabled, lets a buy appear only after a sell.
For a long trade, the next bar's open is the first realistic entry, and the stop belongs under the signal bar's low. Profit can be taken at a fixed risk multiple, or the trade can stay open until purple returns to the line, the moment the volatility cycle behind the arrow is over.
Sell Signal
A sell arrow needs exactly the same climb through 80. The oscillator registers how big a candle is and nothing about where it went, so the direction comes from the candle itself. When the oversized breakout candle closes bearish, a red arrow pointing down appears above its high, the panel changes to SELL, and a short trade would keep its stop above that high.
Size alone is not enough, and the squeeze check is the reason. With Require squeeze within N bars at 10, the indicator looks back over the bars preceding the expansion candle in search of purple. In a market that was already busy, a wide candle finds none and leaves no arrow; a value of 0 switches the check off.
Indicator Settings
MT4 shows all nine inputs in one list, without the Oscillator, Signals and Display headings of the MT5 version.
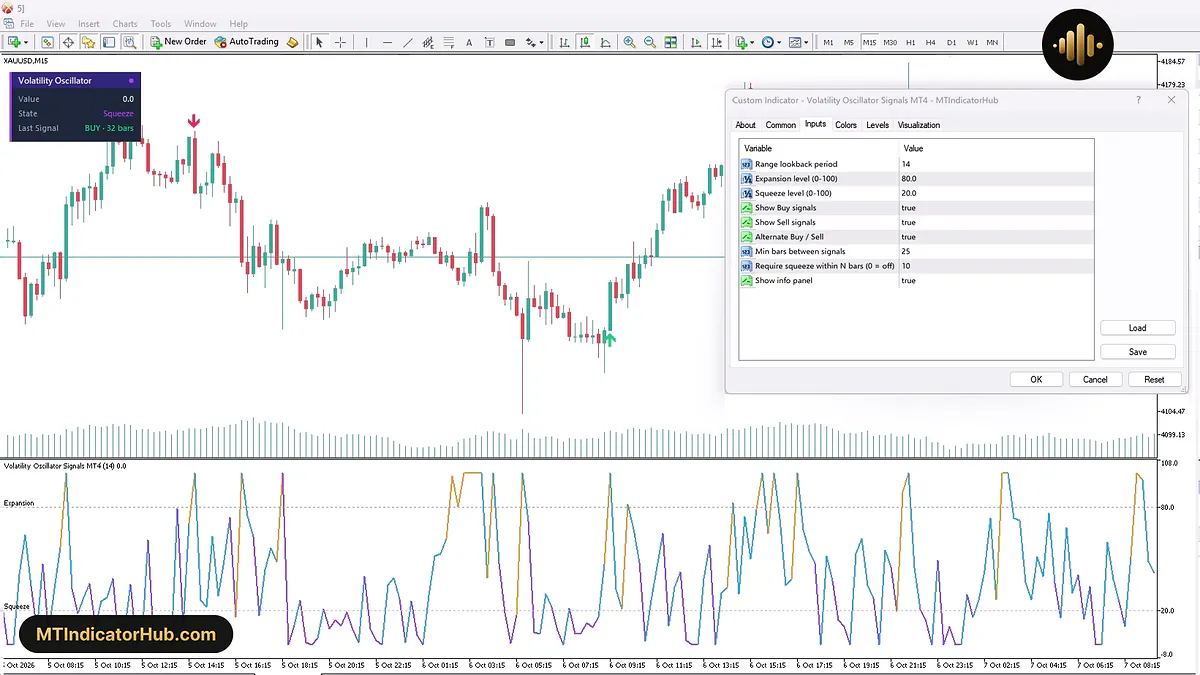
Of the nine, only Range lookback period changes the line itself. The two levels choose where its colour switches and where the dotted Expansion and Squeeze lines are drawn, and the next five inputs decide which arrows make it onto the chart.
| Input | Default | Effect |
|---|---|---|
| Range lookback period | 14 | Size of the group each new candle is ranked in; never fewer than 2 |
| Expansion level (0-100) | 80 | Height an upward cross has to reach for an arrow; held between 1 and 100 |
| Squeeze level (0-100) | 20 | Upper edge of the squeeze zone; always kept one point or more below the Expansion level |
| Show Buy signals | true | Turns green upward arrows on or off |
| Show Sell signals | true | Turns red downward arrows on or off |
| Alternate Buy / Sell | true | With both directions on, each arrow must point the other way from the one before |
| Min bars between signals | 25 | Fewest bars allowed between two arrows |
| Require squeeze within N bars (0 = off) | 10 | How far back the search for purple goes, in bars |
| Show info panel | true | Puts the info panel (Value, State, Last Signal) on the chart or removes it |
Conclusion
Scoring candle size instead of price leaves this oscillator with one clear job: spotting the moment a calm market suddenly opens up, then letting the close of that bar choose the side.
Its limits come from the same design. Whatever happens between two candles, such as a weekend gap, is ignored by the size measure, and since one candle picks the side, a choppy market that swaps between bullish and bearish expansion bars can fool it. The arrow filters remember earlier arrows, so charts holding different amounts of history may disagree on a few signals. Alerts are not included, and the fixed panel at the upper left can sit over part of the price.
Your rating
Rate this indicator
How useful was this indicator? Click a star.
FAQ
Frequently asked questions
Sky blue is the calm middle ground between 20 and 80. Amber shows up at 80 or above, when the candle ranks among the widest of the 14 most recent bars, and purple at 20 or below, when candles have shrunk into a squeeze.
A wide candle earns an arrow only if purple appeared on the line during the 10 bars before it and 25 or more bars have passed since the last arrow; with alternation on, it must also point the other way. Big candles in an already lively market, or too close to an earlier signal, stay unmarked.
No. Big bullish and big bearish candles lift the line in the same way. The direction is added over the candles, where the arrow follows the close of the breakout candle: up for a bullish close, down for a bearish one.
It shows the side of the latest arrow and how many bars have closed since it was drawn, for example BUY · 2 bars. Until the first arrow appears on the chart, it reads None.






Comments
Be the first to comment.