


Oscillators
Free oscillator indicators for MT4 and MT5 that plot momentum or volatility in a separate window, on a fixed 0 to 100 scale or around a zero line.

Trend Continuation Oscillator MT4 Indicator
MT4 oscillator with Bull and Bear Continuation values; a Buy or Sell arrow marks the bar where either one turns positive.

RSI Color Candles MT4 Indicator
Paints each MT4 bar in one of four RSI(14) zones and marks with an arrow the bar where RSI first closes over 60 (Buy) or under 40 (Sell).
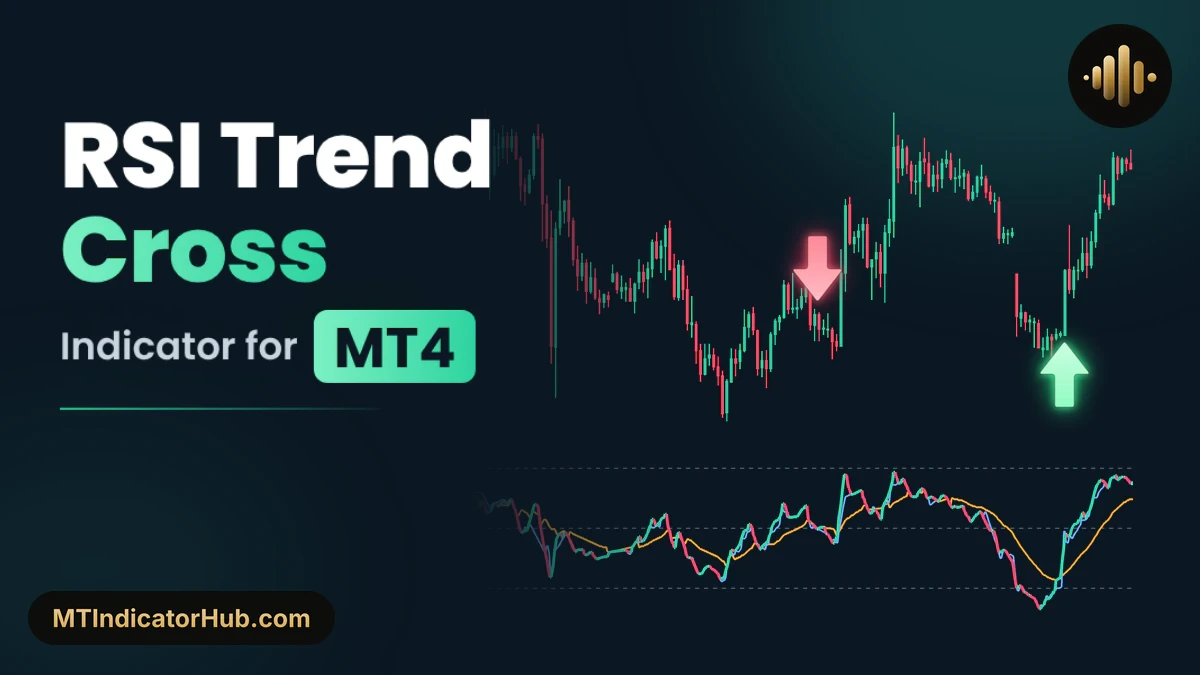
RSI Trend Cross MT4 Indicator
Runs a fast blue and a slow orange line along RSI 14 on MT4 and prints a Buy or Sell Arrow when they cross, filtered by the side of 50.
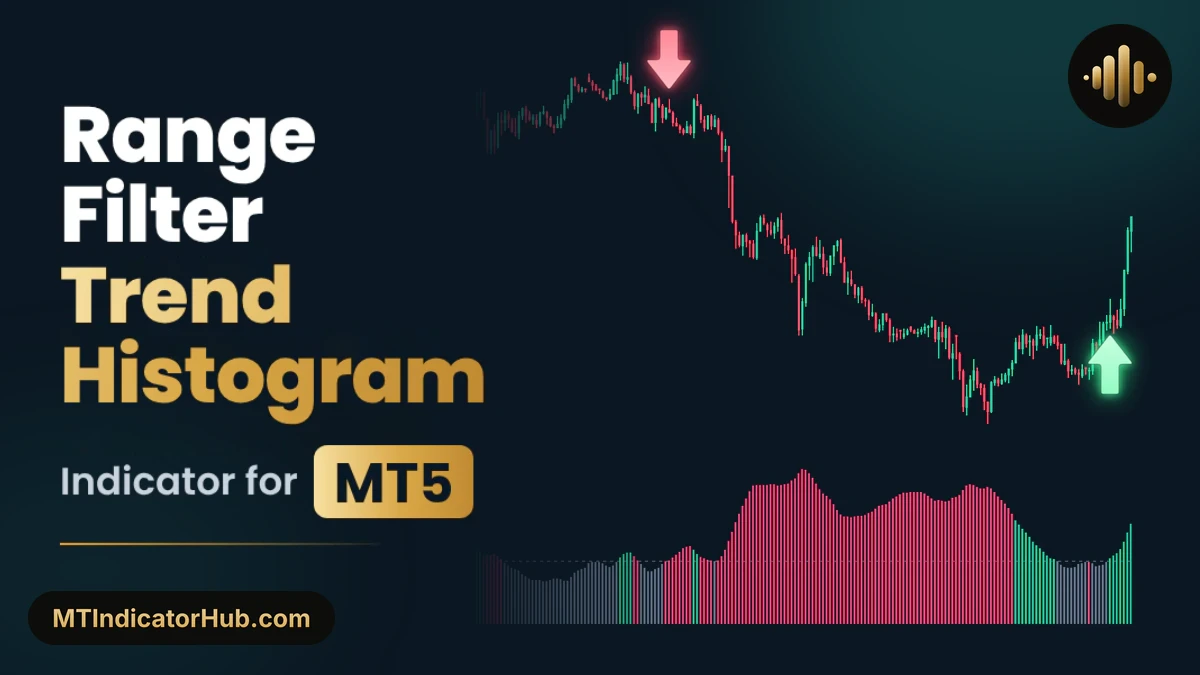
Range Filter Trend Histogram MT5 Indicator
Shows ADX-based trend power as grey, green and red bars around a 20 line and marks the first filtered candle of each new trend with a Buy or Sell arrow.
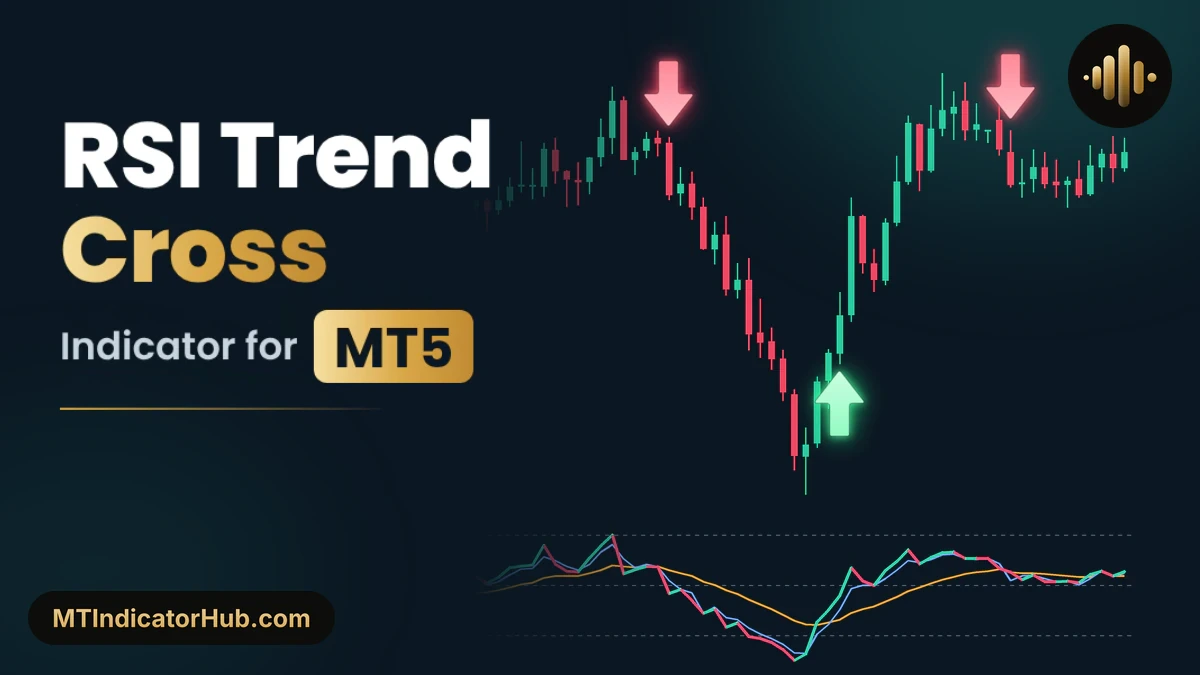
RSI Trend Cross MT5 Indicator
Plots RSI 14 with a fast and a slow signal line and marks the closed candle where they cross: a Buy Arrow under 50, a Sell Arrow above it.
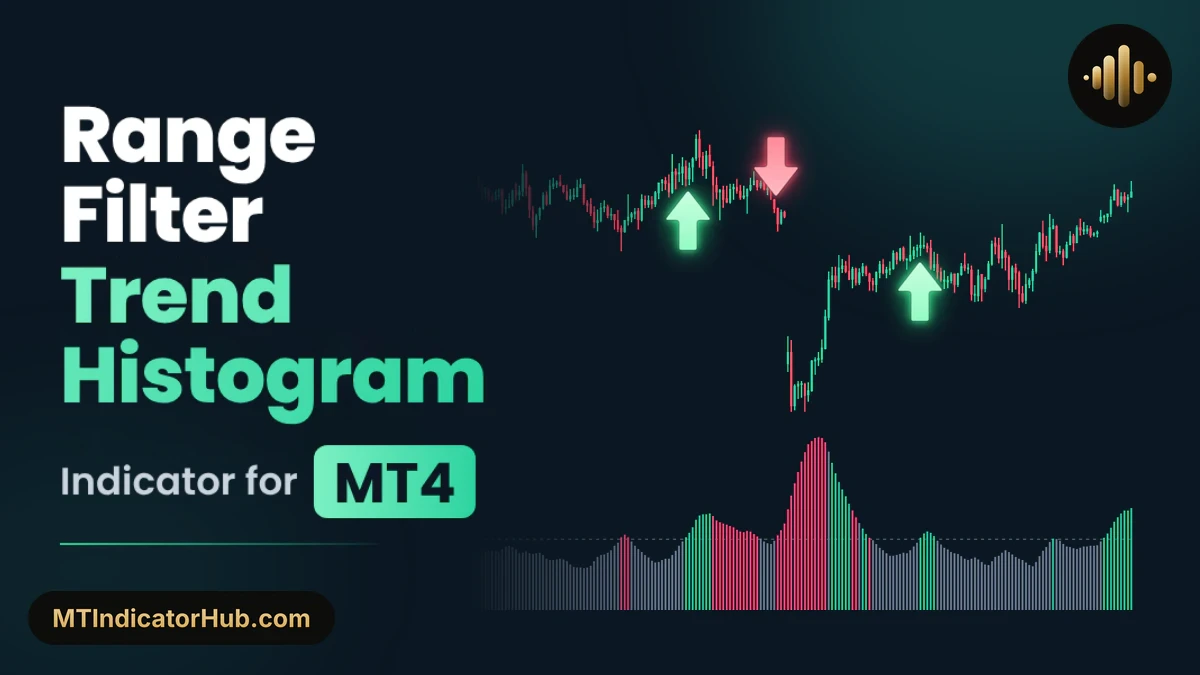
Range Filter Trend Histogram MT4 Indicator
Splits range from trend on MT4 with grey, green and red ADX trend-power bars around 20, and arrows the first candle of a new trend that passes its filters.
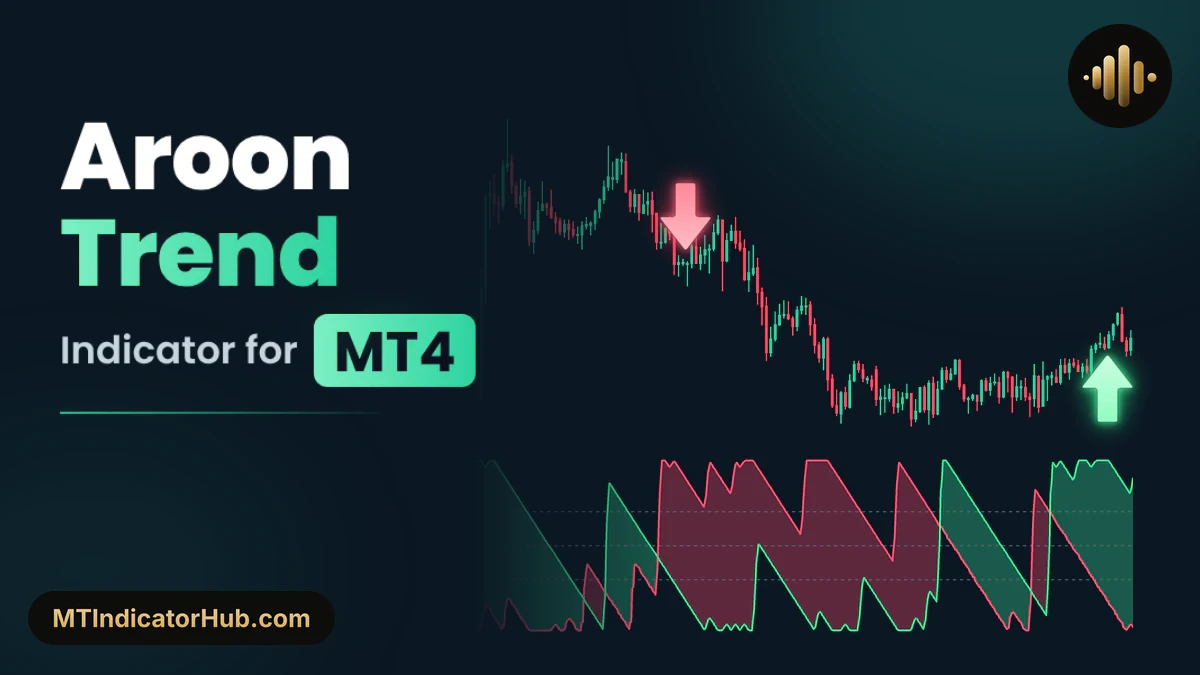
Aroon Trend MT4 Indicator
Counts the candles since the last 25-candle high and low, draws them as two Aroon lines and marks strong trends with Buy and Sell arrows on MT4.
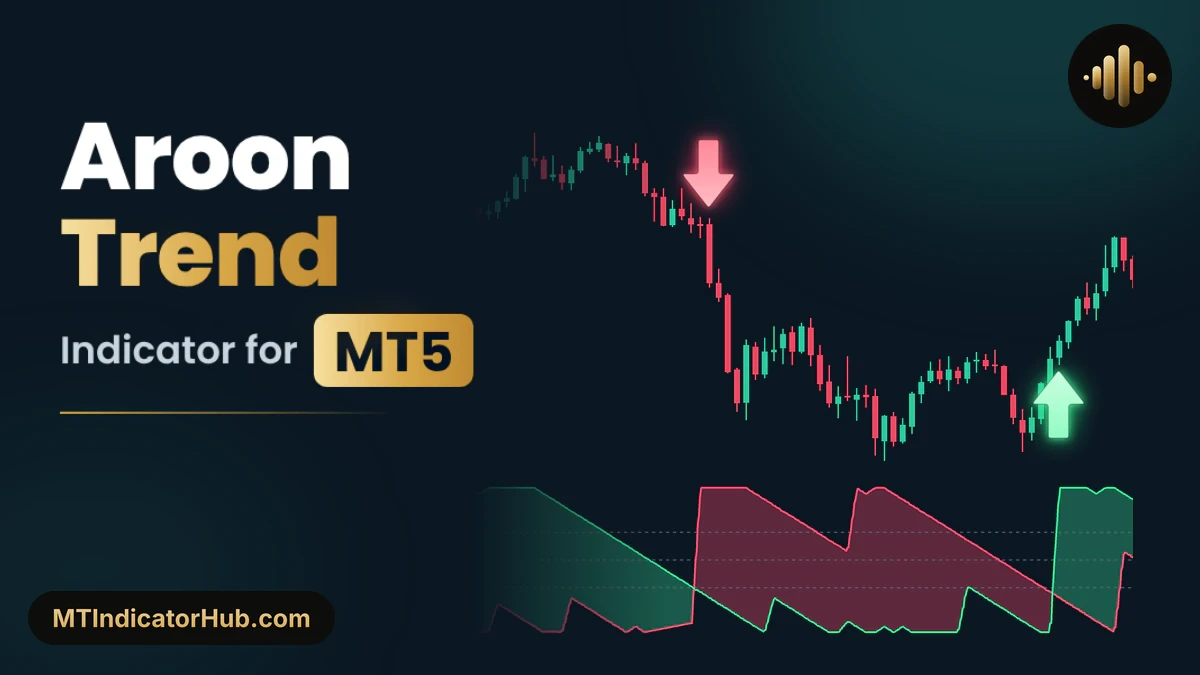
Aroon Trend MT5 Indicator
Draws Aroon Up and Aroon Down from 0 to 100 and prints a Buy or Sell Arrow when one line reaches 70 while the other stays at 30 or lower.
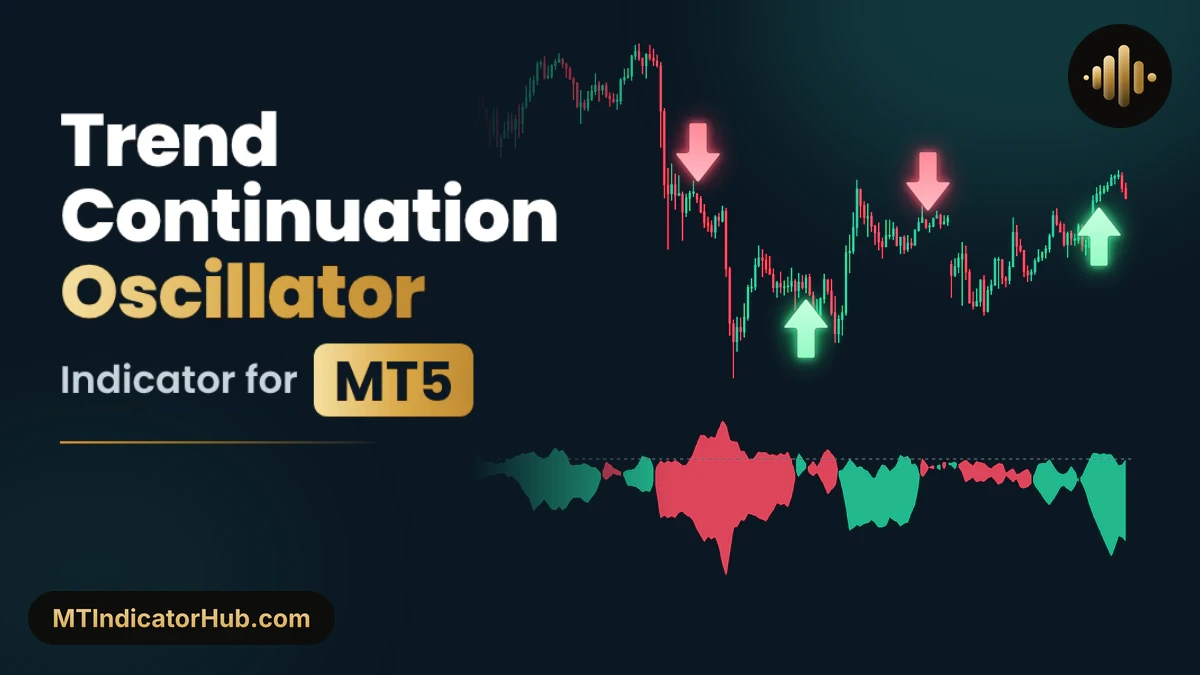
Trend Continuation Oscillator MT5 Indicator
Two lines, Bull and Bear Continuation, filled green or red, with a Buy or Sell arrow on the candle where one of them climbs above zero.
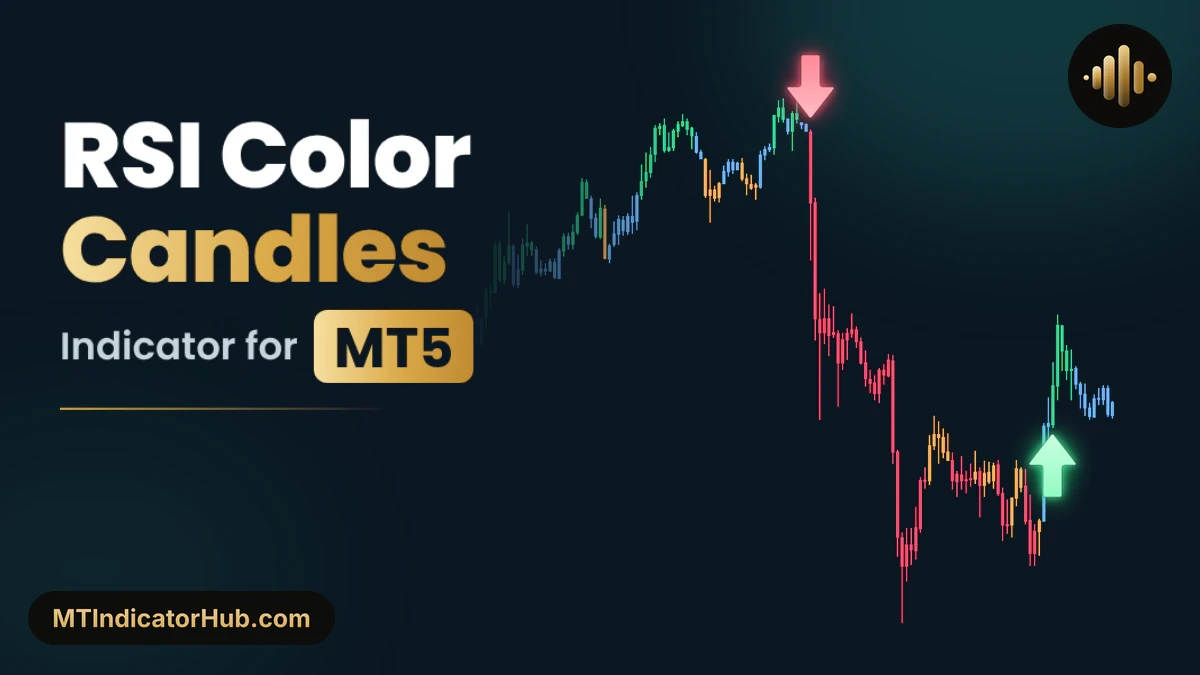
RSI Color Candles MT5 Indicator
Colours every MT5 candle by its RSI(14) zone and prints a Buy or Sell arrow on the first candle that pushes RSI above 60 or below 40.
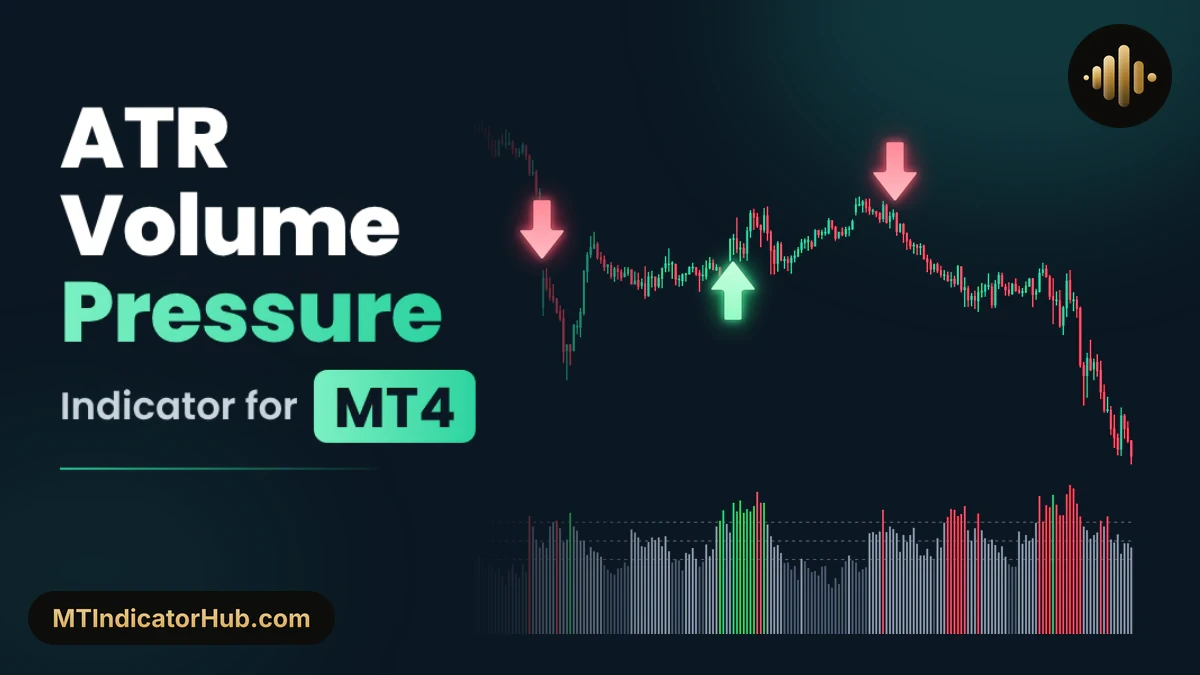
ATR Volume Pressure MT4 Indicator
Rates each MetaTrader 4 candle's range and volume on a 0 to 100 scale and marks the first close above 60 with an arrow whose side follows price 10 bars back.
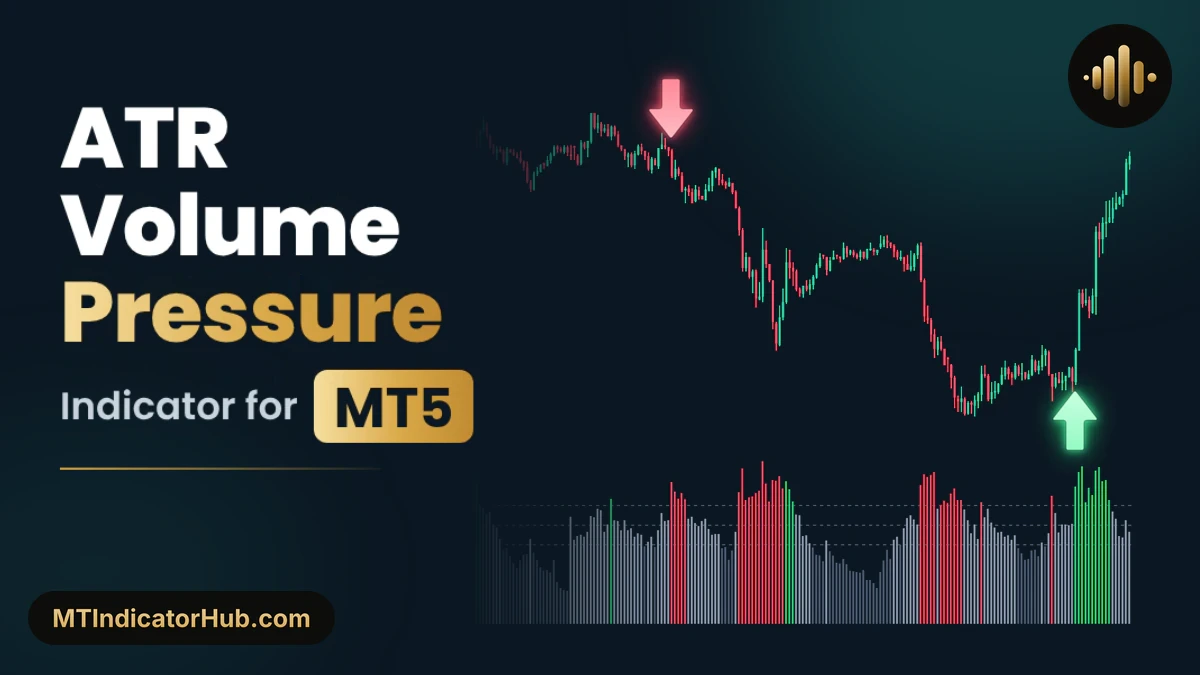
ATR Volume Pressure MT5 Indicator
Joins candle range and volume into a 0 to 100 pressure reading and prints a Buy or Sell arrow on the candle that first breaks it above 60.
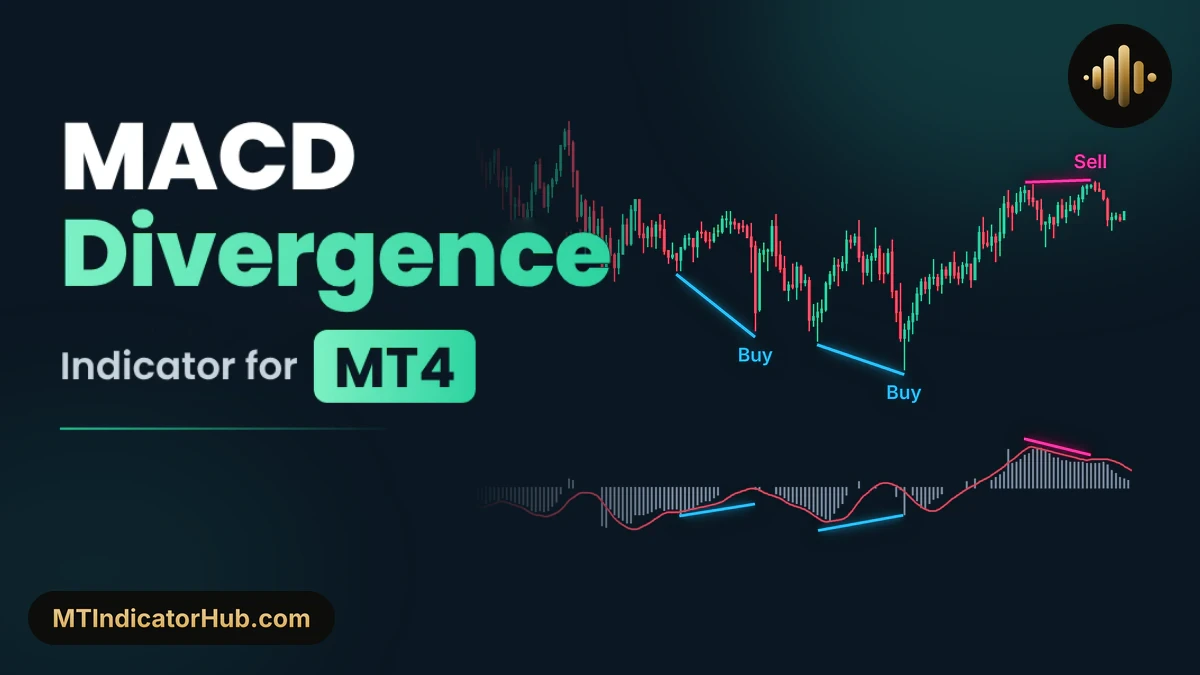
MACD Divergence MT4 Indicator
Sets each new swing high or low against the MACD histogram, then marks a labelled Buy or Sell line on MetaTrader 4 wherever the two move apart.
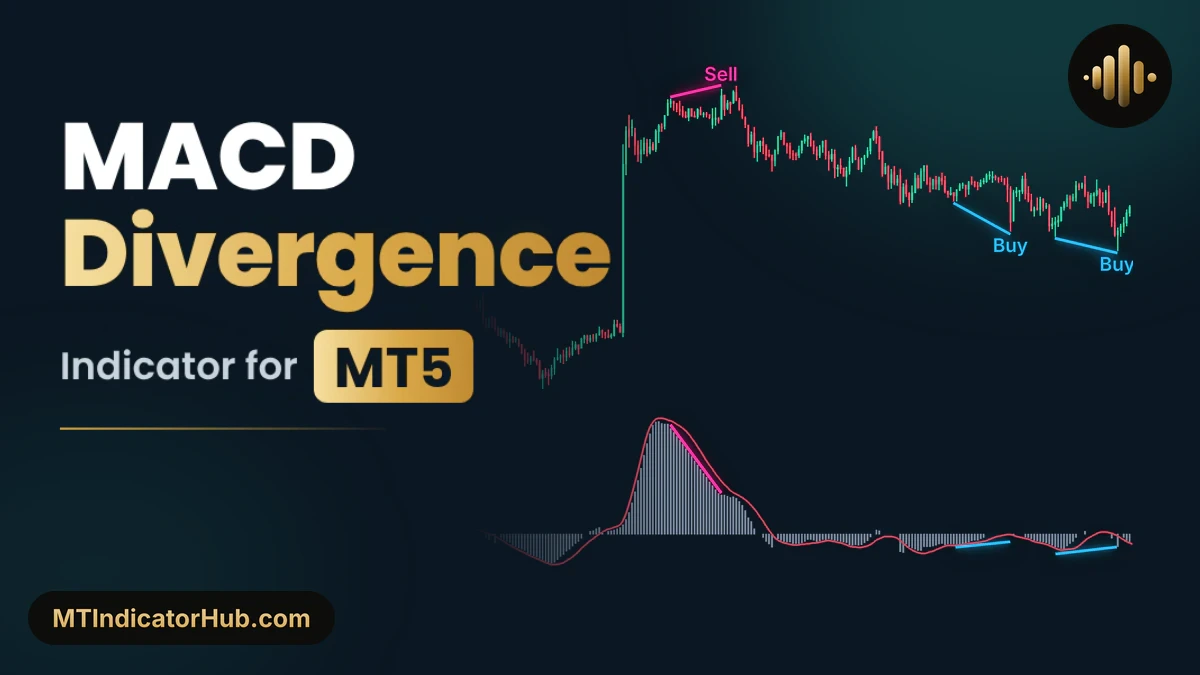
MACD Divergence MT5 Indicator
Pairs two swing points 5 to 30 candles apart with the MACD histogram and draws a blue Buy or pink Sell line on both windows when they disagree.
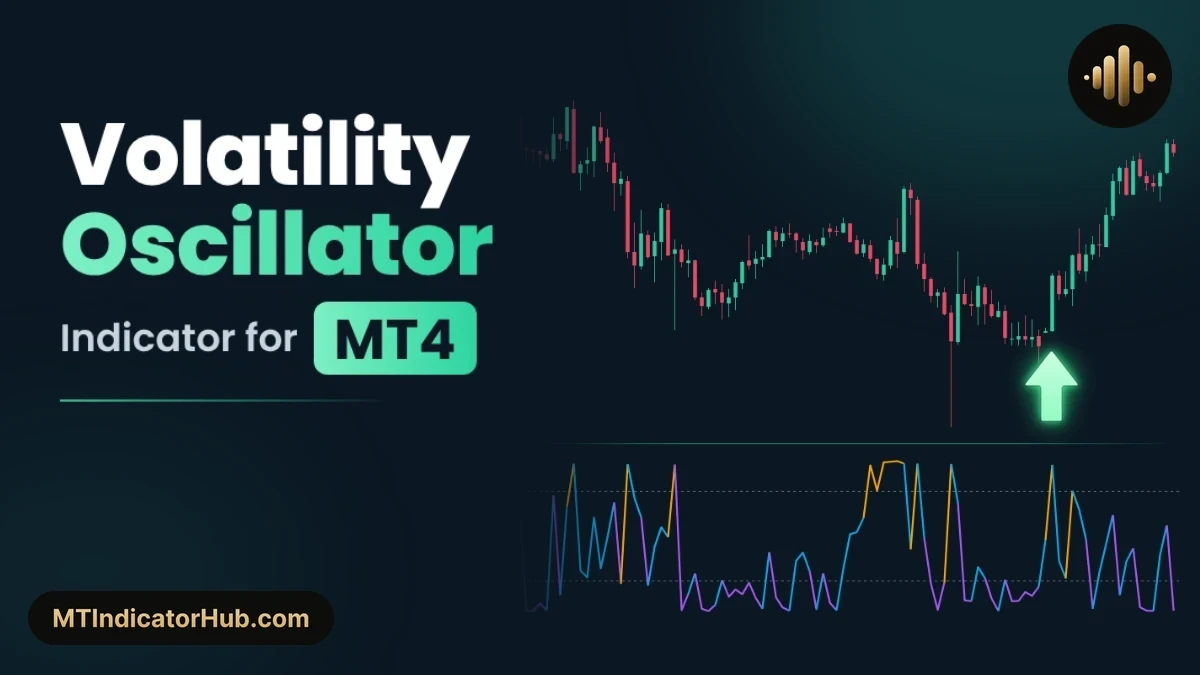
Volatility Oscillator MT4 Indicator
Gives each MT4 candle a 0 to 100 value from its size among the 14 most recent bars, with arrows when a quiet squeeze breaks into expansion.
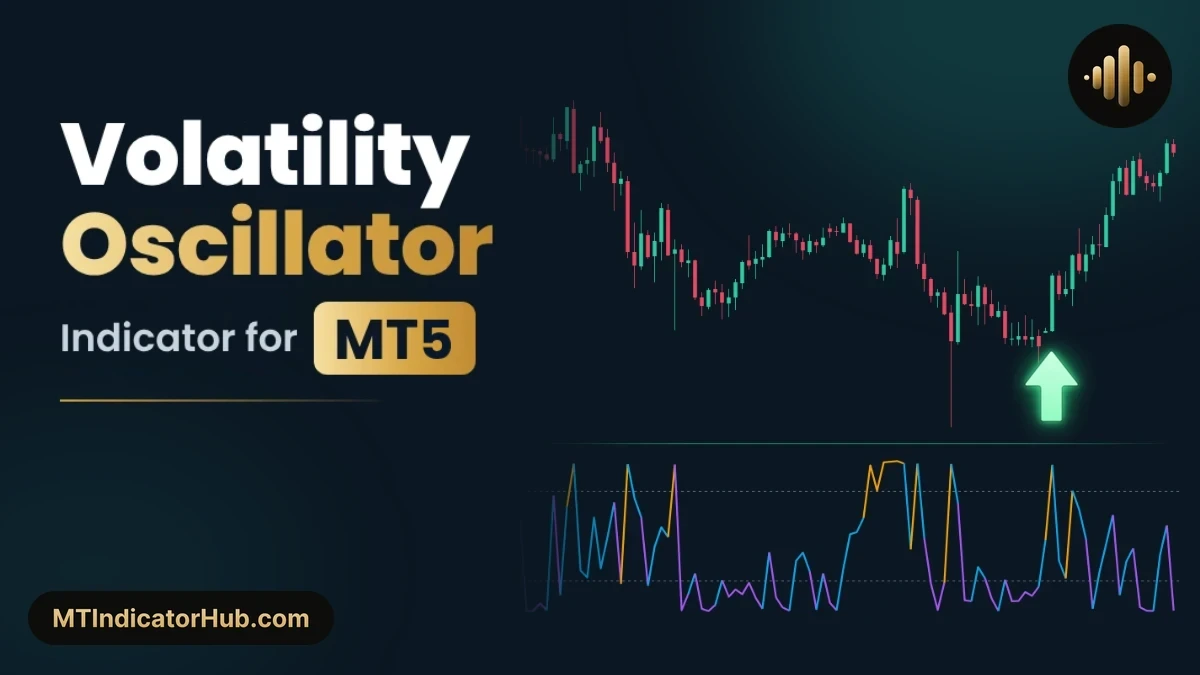
Volatility Oscillator MT5 Indicator
Ranks each candle's size against the last 14 bars from 0 to 100 and marks squeeze-to-expansion breakouts with buy and sell arrows on closed bars.
New MetaTrader 4&5 indicators
Trend Continuation Oscillator MT4 Indicator
MT4 oscillator with Bull and Bear Continuation values; a Buy or Sell arrow marks the bar where either one turns positive.

ICT Killzones MT4 Indicator
Marks the Asian, London, New York AM and New York PM killzones on MT4 as coloured boxes, with green high and red low lines to each session's end.

ICT Killzones MT5 Indicator
Draws the Asian, London, New York AM and New York PM killzones of each day on MT5, with every box's high and low carried on as green and red lines.
RSI Color Candles MT4 Indicator
Paints each MT4 bar in one of four RSI(14) zones and marks with an arrow the bar where RSI first closes over 60 (Buy) or under 40 (Sell).